


J. Phys. D: Appl. Phys. 42 (2009) 055209 |
G Kokkoris et al |
ratios of F were measured. Each run was quite short (<60 s) and the pressure rise and the actinometric ratios were measured about 10 s after plasma ignition. The experimental error is around 10%.
The actinometric ratios for F atoms were measured with actinometric optical emission spectroscopy (OES) by means of a Verity Instrument SD1024D spectrograph. The emission lines of 703.7 nm for F and 750.4 nm for Ar were used.
The actinometric ratio is defined by the ratio of intensity of F emission line over the Ar emission line and is equal to [41]
IF |
= |
K |
−1 |
[F ] |
, |
(1) |
|
|
|||||
IAr |
|
F [Ar] |
|
|||
where KF is the ratio of the excitation efficiencies of F and Ar and depends on several parameters such as cross sections for excitation of F and Ar by electron impact, the electron density and electron energy. Jenq et al [42] theoretically estimated the value of KF to be 0.56 within a factor of two. Schabel et al [43] also theoretically estimated KF to be equal to 2.84. The value of KF was measured by Kawai et al [44] in CF4and C4F8 plasmas from 0.9 to 4.3; they reported a rough estimation for KF to be about 2. In this work, the conversion of the actinometric ratio to absolute F density is based on the lowest value published for KF, i.e. 0.56.
For the calculation of the density of F atoms by (1), besides KF the density of Ar is needed. It is calculated by the partial pressure of Ar, which is the fraction of Ar in the feed [10/(100 + 10)] times pOFF.
3. Experimental results
Before proceeding to the model description and results, a remarkable outcome of the experimental results is commented. The density of F, which is calculated by using (1) and the corresponding actinometric ratios, is shown versus power in figure 1(a) and versus pOFF in figure 1(b). In both figures, the sum of the densities of F and F2 coming from the pressure rise measurements is also shown. The procedure for the calculation of the sum of the densities of F and F2 follows: before the discharge, pOFF is the partial pressure of SF6. If no deposition of SFx radicals occurs, i.e. no permanent loss of SFx radicals on the walls takes place, and no polymerized species, e.g. S2F10, exist in the discharge, then the number of SFx (x = 0–6) molecules during the discharge is equal to the initial number of SF6 molecules before the discharge. In this case, the pressure rise is due to the formation of F and F2 and is equal to the sum of the partial pressures of F and F2.
As shown in figure 1, there is a discrepancy between the values coming from the actinometric ratio and the values coming from the pressure rise. The discrepancy would have been greater if a greater value (>0.56) was used for KF of (1); this is the reason for using the lowest value in the literature for KF. A loss of SFx radicals can account for this discrepancy. To take into account this loss, the deposition of SFx radicals on the reactor walls and/or the formation of dimers, e.g. S2F10, either in the gas phase or on the reactor walls, could be considered. Both cases and their combination were examined. The outcome was that the deposition of SFx radicals was
Figure 1. F density from actinometry and the sum of F and F2 densities from the pressure rise versus (a) power at pOFF equal to 0.921 Pa and versus (b) pOFF (pressure before the ignition of the plasma) at power equal to 2000 W. Note the discrepancy of the two types of measurement, hinting at a loss of SFx radicals.
enough to predict the experimental data. Thus, S2F10 was not finally included in the reactions sets described in the following sections.
4. The model
4.1. The formulation and implementation of the model
The development of the global model implies the formulation of a set of gas phase homogeneous reactions as well as a set of surface (heterogeneous) reactions on the walls of the reactor. Based on these sets, the mass balances of charged and neutral species in the gas phase, the mass balances of the species on the surface and the power balance are formulated in 0D and at steady state. The set of equations is complemented by the charge neutrality equation.
In addition to the former equations and in order to solve the problem, the temperature of the gas, Tgas, and the temperature of the ions, Ti, should be defined. We consider that Tgas is equal to the temperature of the walls. Generally, there is an increase in Tgas during plasma operation compared with that before the discharge. This increase in Tgas at the time instant of the experimental measurements, i.e. a few (about 10) seconds after plasma ignition, is considered small enough to be neglected. In our simulations we consider that the wall temperature is equal to 315 K. Ti is calculated by the empirical equation proposed by Lee and Liebermann [45].
The inputs of the model are the reactor dimensions, pOFF (the pressure before the plasma ignition), the power, the feed of the reactor and Tgas. Two types of problems can be handled: the first is with constant pressure, where the automatic pressure
3
J. Phys. D: Appl. Phys. 42 (2009) 055209 |
G Kokkoris et al |
controller is on; in this case, the pressure after plasma ignition is equal to pOFF. The second is with constant volumetric flow rate at the outlet; in this case, the pressure after plasma ignition can be different from pOFF and is calculated from the ideal gas law by summing the densities of all neutral species. This work deals with the second type of problems. The outputs of the model are the densities of neutral and charged species and electrons and the temperature of electrons. The derived outputs are the pressure rise and the effective sticking coefficients of the neutral species. The equations of the global model and a discussion on the two types of problems is included in a recent work [36] for C4F8 plasmas.
The mathematical problem resulting from the balances of the model is a set of non-linear algebraic equations, which is solved numerically by a modified Newton Raphson method [37]. Code in C++ programming language has been developed for the implementation of the computational framework.
4.2. The set of gas phase reactions |
|
|
|
|||
The |
set |
of gas |
phase reactions |
of |
the |
global model |
for |
SF6 |
plasmas |
is shown in |
table |
1. |
It includes |
ionizations, dissociations, attachments, detachments, as well as recombinations of charged and neutral species. The species
considered in the gas phase are SF6, SF5, SF4, SF3, F2, F, SF+5 , SF+4 , SF+3 , F2+, SF−6 and F−.
The general form of a coefficient for a gas phase reaction is
kG = exp |
A + B ln Te + Te |
+ Te2 |
+ Te3 |
, |
(2) |
|||
|
|
C |
|
D |
|
E |
|
|
where Te is the electron temperature in eV. Te is considered as two thirds of the mean electron energy for a Maxwellian or a non-Maxwellian EEDF. Table 1 includes parameters A, B, C, D, E and the energy loss for each reaction, which is necessary for the solution of the power balance. The energy loss of a reaction is considered equal to the threshold energy of the reaction. The literature sources or the method of calculation of the coefficients are also included in table 1.
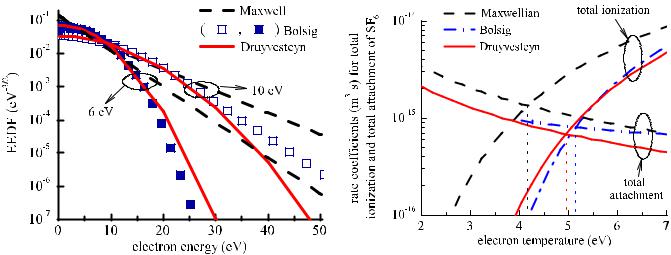
In order to calculate the coefficients of the electron impact reactions, the EEDF is needed. In figure 2, the EEDF resulting from the numerical solution of the Boltzmann equation by Bolsig [46], as well as the Druyvesteyn and Maxwellian EEDF, are shown for two values of mean electron energy (6 and 10 eV). Note that only the cross sections for SF6 (and not for the fragments of SF6) were used for the calculation of the EEDF by Bolsig. The Druyvesteyn EEDFs are closer to those of Bolsig compared with the Maxwellian EEDFs, even though there is a divergence at the high energy tail.
There were two difficulties in using the EEDF from Bolsig. The first one was the problems of numerical convergence for mean energies below 6 eV. We could not find the EEDF and the rate coefficients at mean energies below 6 eV. The second difficulty was that at conditions where the parent gas is strongly dissociated (e.g. high power and/or low pressure): one would have to include the cross sections of electron impact reactions for the fragments of SF6 and solve the Boltzamnn equation for a mixture with a—varying over conditions— composition. In other words, one would have to couple the
numerical solution of the Boltzmann equation with the global model, i.e. to find a different EEDF for each condition. This approach would diminish the simplicity and fast convergence of the global model. Given the above difficulties, as well as the resemblance of the Druyvesteyn EEDF to the one from Bolsig, we decided to use the Druyvesteyn EEDF to calculate the rate coefficients of the electron impact reactions. However, we also present the coefficients for the case of a Maxwellian EEDF (see the second row at each reaction in table 1) which has been discussed in previous works [17, 18, 28, 47] on SF6 (SF6/Ar) plasmas.
In order to estimate the effect of the EEDF on the results, we made a simple calculation based on the balance of ionization (reactions (G8)–(G10) in table 1) and attachment (reactions (G17) and (G18) in table 1) in SF6 plasma:
ktotal ionization(Te)nenSF6 = ktotal attachment(Te)nenSF6 |
|
ktotal ionization(Te) = ktotal attachment(Te). |
(3) |
By solving (3), Te can be calculated. Graphical solutions of (3) are shown in figure 3 by using the EEDF coming from Bolsig, a Maxwellian EEDF and a Druyvesteyn EEDF: the
intersection of ktotal ionization with ktotal attachment, called the balance point hereafter, defines Te in each case. Te is almost
the same for the EEDF coming from Bolsig (5.11 eV) and the Druyvesteyn EEDF (4.96 eV) at the balance point. Te is underestimated by approximately 1 eV (4.17 eV compared with 5.11 eV) in the case of the Maxwellian EEDF.
We could roughly estimate the effect of the EEDF on the electron impact reaction coefficients by the difference in the total ionization (total attachment) coefficients at the balance point. As shown in figure 3, the ratio of the coefficient of the total ionization for the Druyvesteyn EEDF over the one coming from Bolsig is 0.85, while the same ratio for the Maxewellian EEDF over the one from Bolsig is 1.7.
To summarize, a rough estimation is that by using a Druyvesteyn EEDF, Te and the rate coefficients will be almost the same compared with those coming from Bolsig. By assuming a Maxwellian EEDF, Te is underestimated by about 1 eV and the rate coefficients are overestimated by a factor of less than two (1.7).
An open issue is the electron impact dissociation of SF6 into neutral fragments. Does SF6 dissociate through different single steps into SFx radicals, e.g. into SF4+2F, SF3+3F, or does it dissociate through a multi-step process, i.e. into SF5, which in turn dissociates into SF4, etc? What are the cross sections for each scenario?
The only work including measurements for electron impact dissociation of SF6 was that of Iio et al [16]. They reported several dissociation paths with their thresholds and measured the relative cross sections for electron impact dissociation of SF6 into SF, SF2 and SF3. SF4 and SF5 were below their detection system. However, Christophorou and Olthoff [12] deduced cross sections for the total dissociation into neutral fragments, which was seen to have a different energy dependence from the sum of the cross sections for the dissociation of SF6 into SF3, SF2 and SF reported by Iio et al [16].
4

J. Phys. D: Appl. Phys. 42 (2009) 055209 |
G Kokkoris et al |
Table 1. The set of gas phase reactions and the values of parameters A, B, C, D and E of (2) for the calculation of the rate coefficients (m3 s−1). The first line of each reaction includes the parameters for a Druyvesteyn EEDF and the second line includes the parameters for a Maxwellian EEDF. The energy threshold (Eth) for each reaction is also shown.
|
|
|
|
|
|
|
|
|
|
|
|
|
Parameters for rate coefficients |
|
|
|
|
||||
Index |
Reaction |
|
|
|
|
|
Eth (eV) |
|
|
|
|
|
|
|
|
Com. |
Ref. |
||||
|
|
|
|
|
A |
|
B |
|
C |
D |
E |
||||||||||
|
|
|
|
|
|
|
|
|
|
|
|
|
|
||||||||
|
Neutral dissociations |
|
−29.35 |
−0.2379 |
−14.11 |
−15.25 |
−1.204 |
|
|
||||||||||||
(G1) |
SF6 |
+ e → SF5 |
+ F + e |
9.6 |
a,c |
[12, 16] |
|||||||||||||||
(G2) |
SF6 |
+ e → SF4 |
|
|
|
−29.57 |
−0.2859 |
−13.80 |
|
1.148 |
−0.0781 |
b,c |
|
||||||||
+ 2F + e |
12.1 |
−31.61 |
−0.2592 |
−10.00 |
−31.24 |
−0.7126 |
a,c |
[12, 16] |
|||||||||||||
(G3) |
SF6 |
+ e → SF3 |
|
|
|
−31.37 |
−0.3721 |
−14.42 |
|
0.5679 |
−0.0375 |
b,c |
|
||||||||
+ 3F + e |
16.0 |
−40.26 |
|
3.135 |
5.895 |
−64.68 |
0.2607 |
|
a,c |
[12, 16] |
|||||||||||
(G4) |
SF5 |
+ e → SF4 |
|
|
|
−33.91 |
|
1.237 |
−15.06 |
−0.0081 |
−0.0042 |
b,c |
|
||||||||
+ F + e |
9.6 |
−29.36 |
−0.2379 |
−14.11 |
−15.25 |
−1.204 |
same |
— |
|||||||||||||
(G5) |
SF4 |
+ e → SF3 |
|
|
|
−29.57 |
−0.2859 |
−13.80 |
|
1.148 |
−0.0781 |
as (G1) |
|
||||||||
+ F + e |
9.6 |
−29.36 |
−0.2379 |
−14.11 |
−15.25 |
−1.204 |
same |
— |
|||||||||||||
(G6) |
F2 + e → 2F + e |
|
|
−29.57 |
−0.2859 |
−13.80 |
|
1.148 |
−0.0781 |
as (G1) |
|
||||||||||
|
3.16 |
−31.44 |
−0.6986 |
−5.170 |
−1.389 |
−0.0650 |
a |
[48, 49] |
|||||||||||||
(G7) |
F2 + e → 2F + e |
|
|
−31.89 |
−0.5549 |
−5.238 |
|
0.4288 |
−0.0266 |
b |
|
||||||||||
|
4.34 |
−33.44 |
−0.2761 |
−3.564 |
−3.946 |
−0.0393 |
a |
[48, 49] |
|||||||||||||
|
Ionizations |
|
|
|
|
|
−33.36 |
−0.2982 |
−5.312 |
|
0.1970 |
−0.0124 |
b |
|
|||||||
|
|
|
|
|
|
−33.66 |
|
|
−4.594 |
−56.66 |
−0.3226 |
|
|
||||||||
(G8) |
SF6 |
+ e → SF5+ + 2e + F |
15.5 |
1.212 |
a |
[12, 15, 16] |
|||||||||||||||
(G9) |
SF6 |
|
|
|
|
+ |
|
|
−31.46 |
0.5827 |
−15.62 |
|
0.0392 |
−0.0028 |
b |
|
|||||
+ e → SF4 |
+ 2e + 2F |
18.5 |
−37.14 |
1.515 |
−4.829 |
−80.42 |
−0.7924 |
a |
[12, 15, 16] |
||||||||||||
(G10) |
SF6 |
|
|
|
|
+ |
|
|
−34.41 |
0.7534 |
−18.39 |
|
0.0054 |
−0.0010 |
b |
|
|||||
+ e → SF3 |
+ 2e + 3F |
20 |
−36.82 |
1.740 |
−0.1047 |
−98.18 |
0.1060 |
|
a |
[12, 15, 16] |
|||||||||||
(G11) |
SF5 |
|
|
|
|
+ |
|
|
−33.01 |
0.6900 |
−19.32 |
−0.1185 |
0.0065 |
|
b |
|
|||||
+ e → SF5 |
+ 2e |
11.2 |
−34.92 |
1.487 |
−2.377 |
−29.71 |
−0.1449 |
a |
[14] |
||||||||||||
(G12) |
SF5 |
|
|
|
|
+ |
|
|
−32.78 |
0.8601 |
−10.76 |
−0.0558 |
0.0025 |
|
b |
|
|||||
+ e → SF4 |
+ F + 2e |
14.5 |
−36.27 |
1.892 |
−1.387 |
−50.87 |
−0.0758 |
a |
[14] |
||||||||||||
(G13) |
SF4 |
|
|
|
|
+ |
|
|
−33.20 |
1.0177 |
−13.76 |
−0.1309 |
0.0075 |
|
b |
|
|||||
+ e → SF4 |
+ 2e |
13 |
−32.95 |
0.8763 |
−10.19 |
−31.21 |
−3.989 |
a,d |
[14, 16] |
||||||||||||
(G14) |
SF4 |
|
|
|
|
+ |
|
|
−32.01 |
0.5939 |
−14.83 |
|
2.220 |
−0.9045 |
b,d |
|
|||||
+ e → SF3 |
+ F + 2e |
14.5 |
−32.75 |
0.8222 |
−10.82 |
−40.59 |
−4.274 |
a,d |
[14, 16] |
||||||||||||
(G15) |
SF3 |
|
|
|
|
+ |
|
|
−31.78 |
0.5357 |
−16.26 |
|
1.974 |
−0.7729 |
b,d |
|
|||||
+ e → SF3 |
+ 2e |
11 |
−35.55 |
1.750 |
−2.086 |
−28.70 |
−0.1357 |
a |
[14] |
||||||||||||
|
|
|
|
|
|
+ |
|
|
|
|
−33.23 |
1.073 |
−10.36 |
−0.1016 |
0.0055 |
|
b |
|
|||
(G16) |
F2 + e → F2 |
+ 2e |
15.69 |
−35.60 |
1.467 |
−6.140 |
−57.14 |
−0.4860 |
a |
[14] |
|||||||||||
|
Attachments |
|
|
|
|
−33.38 |
0.8249 |
−15.96 |
|
0.0655 |
−0.0041 |
b |
|
||||||||
|
|
|
|
|
−33.43 |
−1.173 |
−0.5614 |
|
|
−0.0145 |
|
|
|||||||||
(G17) |
SF6 |
+ e → SF5 |
+ F− |
0.1 |
|
0.1798 |
a |
[12] |
|||||||||||||
|
|
6 |
|
→ |
|
6 |
|
|
|
−33.40 |
−1.061 |
−0.1017 |
−0.0161 |
0.0006 |
|
b |
|
||||
(G18) |
SF |
+ e |
|
|
|
|
− |
33.46 |
− |
1.500 |
0.0002 |
− |
0.0023 |
0 |
|
a |
[12] |
||||
|
|
|
SF− |
|
|
|
|
|
|
||||||||||||
(G19) |
F2 + e → F + F− |
|
|
−32.77 |
−1.500 |
−0.0788 |
|
0.0013 |
0 |
|
b |
|
|||||||||
|
|
−33.31 |
−1.487 |
−0.2795 |
|
0.0109 |
−0.0004 |
a |
[48, 49] |
||||||||||||
|
Detachment |
|
|
|
|
−32.81 |
−1.440 |
−0.5283 |
|
0.0558 |
−0.0028 |
b |
|
||||||||
|
|
|
|
|
−44.39 |
|
|
|
|
|
|
|
|
|
|||||||
(G20) |
F− + N → F + N + e, |
|
0 |
|
0 |
0 |
|
0 |
|
e |
[12] |
||||||||||
|
N =SF6, SF5, SF4, SF3, F, F2 |
|
|
|
|
|
|
|
|
|
|
|
|
||||||||
(G21) |
SF− + N |
→ |
SF |
+ N + e |
|
− |
44.98 |
0 |
|
0 |
0 |
|
0 |
|
e |
[12] |
|||||
|
|
6 |
|
|
|
6 |
|
|
|
|
|
|
|
|
|
|
|
|
|||
|
N =SF6, SF5, SF4, SF3, F, F2 |
|
|
|
|
|
|
|
|
|
|
|
|
||||||||
|
Momentum transfer |
|
−29.15 |
|
|
−1.455 |
|
|
−0.0141 |
|
|
||||||||||
(G22) |
SF6 |
+ e → SF6 |
+ e |
|
|
0.2126 |
|
0.2456 |
a |
[12] |
|||||||||||
(G23)–(G25) |
SFx + e → SFx + e, x = 3, 4, 5 |
|
−29.23 |
|
0.2158 |
−1.400 |
|
0.2460 |
−0.0145 |
b |
|
||||||||||
|
−29.15 |
|
0.2126 |
−1.455 |
|
0.2456 |
−0.0141 |
same |
— |
||||||||||||
(G26) |
F2 + e → F2 + e |
|
|
−29.23 |
|
0.2158 |
−1.400 |
|
0.2460 |
−0.0145 |
as(G22) |
|
|||||||||
|
|
−29.04 |
−0.0987 |
−0.4897 |
−0.0319 |
0.0055 |
|
a |
[48, 49] |
||||||||||||
|
F + e → F + e |
|
|
|
−29.01 |
−0.1088 |
−0.6889 |
|
0.0533 |
−0.0011 |
b |
|
|||||||||
(G27) |
|
|
|
−29.04 |
−0.0987 |
−0.4897 |
−0.0319 |
0.0055 |
|
same |
— |
||||||||||
|
Excitations |
|
|
|
|
|
−29.01 |
−0.1088 |
−0.6889 |
|
0.0533 |
−0.0011 |
as(G26) |
|
|||||||
|
|
|
|
|
|
−24.81 |
−2.174 |
−13.47 |
|
|
−4.400 |
|
|
||||||||
(G28) |
Total vibrational excitation of SF6 |
0.09 |
|
12.45 |
a |
[12] |
|||||||||||||||
(G29) |
Vibrational excitation of F2 |
|
−26.84 |
−1.461 |
−8.346 |
|
7.867 |
−2.913 |
b |
|
|||||||||||
0.1108 |
−33.85 |
−1.549 |
−0.6197 |
|
0.0306 |
−0.0012 |
a |
[48, 49] |
|||||||||||||
|
|
|
|
|
|
|
|
|
|
|
−33.47 |
−1.460 |
−0.9889 |
|
0.1224 |
−0.0070 |
b |
|
|||
5
J. Phys. D: Appl. Phys. 42 (2009) 055209 |
|
|
|
|
|
|
|
G Kokkoris et al |
||||
|
|
|
Table 1. Continued. |
|
|
|
|
|
|
|
||
|
|
|
|
|
|
|
|
|
|
|
||
|
|
|
|
|
Parameters for rate coefficients |
|
|
|
|
|
||
|
Index |
Reaction |
Eth (eV) |
|
|
|
|
|
|
Com. |
Ref. |
|
|
A |
B |
C |
D |
E |
|||||||
|
|
|
|
|
|
|
|
|
|
|
|
|
|
(G30) |
Vibrational excitation of F2 |
0.2188 |
−33.57 |
−1.552 |
−0.6555 |
0.0224 |
−0.0012 |
a |
[48, 49] |
|
|
(G31) |
Vibrational excitation of F2 |
|
−33.19 |
−1.460 |
−1.061 |
0.1228 |
−0.0071 |
b |
|
|
||
0.3237 |
−33.90 |
−1.554 |
−0.6757 |
0.0041 |
−0.0008 |
a |
[48, 49] |
|
||||
(G32) |
Vibrational excitation of F2 |
|
−33.53 |
−1.460 |
−1.135 |
0.1202 |
−0.0069 |
b |
|
|
||
0.4205 |
−35.01 |
−1.546 |
−0.6177 |
−0.0295 |
0.0001 |
|
a |
[48, 49] |
|
|||
(G33) |
Excitation of F2 |
|
−34.62 |
−1.460 |
−1.1440 |
0.1037 |
−0.0060 |
b |
|
|
||
11.57 |
−33.89 |
0.7953 |
−6.732 |
−29.19 |
−0.5969 |
a |
[48, 49] |
|
||||
(G34) |
Excitation of F2 |
|
−32.57 |
0.3734 |
−12.69 |
0.3318 |
−0.0227 |
b |
|
|
||
13.08 |
−39.03 |
1.740 |
−3.465 |
−40.04 |
−0.2956 |
a |
[48, 49] |
|
||||
|
|
Neutral recombinations |
|
−36.25 |
0.9008 |
−13.30 |
0.1361 |
−0.0107 |
b |
|
|
|
|
|
|
−42.83 |
|
|
|
|
|
|
|
|
|
(G35) |
F + SF5 → SF6 |
|
0 |
0 |
0 |
0 |
|
e,f |
[25] |
|
||
|
(G36) |
F + SF4 → SF5 |
|
−42.83 |
0 |
0 |
0 |
0 |
|
e,f |
[25] |
|
|
(G37) |
F + SF3 → SF4 |
|
−42.83 |
0 |
0 |
0 |
0 |
|
e,f |
[25] |
|
|
(G38) |
F2 + SF5 → SF6 + F |
|
−46.41 |
0 |
0 |
0 |
0 |
|
e |
[26] |
|
|
(G39) |
F2 + SF4 → SF5 + F |
|
−46.41 |
0 |
0 |
0 |
0 |
|
e |
[26] |
|
|
(G40) |
F2 + SF3 → SF4 + F |
|
−46.41 |
0 |
0 |
0 |
0 |
|
e |
[26] |
|
|
(G41) |
SF5 + SF5 → SF6 + SF4 |
|
−41.50 |
0 |
0 |
0 |
0 |
|
e |
[25] |
|
|
(G42)−(G49) |
Ion recombinations |
|
−29.93 |
|
|
|
|
|
|
|
|
|
I + + J − → I + J , |
|
0 |
0 |
0 |
0 |
|
e |
[20, 26] |
|
||
|
|
I = SF5, SF4, SF3, F2, J = SF6, F |
|
|
|
|
|
|
|
|
|
|
|
|
Ion–molecule reactions |
|
−39.65 |
|
|
|
|
|
|
|
|
|
(G50) |
SF6 + SF5+ → SF6 + SF3+ + F2 |
|
0 |
0 |
0 |
0 |
|
e |
[50] |
|
|
aIntegrate the cross section data from literature over a Druyvesteyn EEDF.
bIntegrate the cross section data from literature over a Maxwellian EEDF.
cIntegrate one of the three cross section data resulting from the ‘deconvolution’ of the total neutral dissociation (figure 4).
dThe cross section data of SF4 total ionization were equally branced to SF+4 and SF+3 .
eFrom the literature.
fThe coefficient is calculated by the formula of Ryan and Plumb [25] and depends on the pressure. The values shown are at 2 Pa.
Figure 2. EEDF from Bolsig (points) as well as the Maxwellian (dashed curve) and the Druyvesteyn (solid curve) EEDF at mean electron energies of 6 and 10 eV. Note that only the cross sections for SF6 (and not for the fragments of SF6) were used for the calculation of the EEDF by Bolsig.
Regarding the computational studies, Kline [24] considered a multi-step dissociation chain of SF6, suggesting that the dominant dissociation products were SF5, and Anderson et al [26] considered several single-step dissociation reactions of SF6 into SFx radicals and supported, based on
Figure 3. The total ionization and the total attachment rate coefficients versus the electron temperature for a Maxwellian EEDF (dashed curves), a Druyvesteyn EEDF (solid curves) and the EEDF coming from Bolsig (dash–dot curves). At the balance points, electron temperature is equal to 4.16 eV, 4.96 eV, and 5.11 eV respectively.
energetic considerations, that the most dominant species are likely to be larger fragments of SF6. Riccardi et al [17] considered both single and multi-step dissociation of SF6; the rate coefficients for the single-step dissociations of SF6 into
6

J. Phys. D: Appl. Phys. 42 (2009) 055209 |
G Kokkoris et al |
Figure 4. ‘Deconvolution’ of the cross section data for total neutral dissociation of SF6 coming from Christophorou and Olthoff [12] to three dissociation paths. We assume that the first two paths (to
SF5 + F, SF4 + 2F) contribute mainly to the first peak of the total neutral dissociation, and the third (to SF3 + 3F contributes) mainly to the second peak.
(x = 2–5) radicals were two orders of magnitude lower than these for the multi-step dissociation. Rauf et al [20, 27] considered single-step dissociation paths of SF6 into SF3 and SF2, used the total cross sections of Christophorou and Olthoff [12] and considered a branching 2/3 to SF3 and 1/3 to SF2. Ryan and Plumb [25] considered that the main path of electron impact dissociation of SF6 was to SF2+4F.
In this work, we combined the most recent data of Christophorou and Olthoff [12] with the paths reported by Iio et al [16] and the relative maxima of the dissociative ionizations of SF6. We considered both single and multi-step dissociation of SF6. Three paths of single-step dissociation of SF6 into SF5, SF4 and SF3 (see reactions (1)–(3) in table 1, (G1)–(G3)) were taken into account. As the cross sections for each path were not available, they came from a ‘deconvolution’ of the total cross sections [12]. The ‘deconvolution’ was done into three curves each one corresponding to one dissociation reaction. The first rule for the ‘deconvolution’ was based on the shape of the cross section data for the total dissociation (see the two peaks of the curve in figure 4) and the thresholds of dissociation paths estimated by Iio et al [16]. In particular, we considered that the first two reactions ((G1) and (G2)) contributed mainly to the first peak of the total dissociation data, while the third (G3) contributed mainly to the second peak. The second rule for the ‘deconvolution’ was that the ratio of the maxima of the cross sections of the reactions were assumed to follow the ratio of the maxima of the corresponding dissociative ionization reactions [15]. As the higher cross sections for dissociative ionization are those for the formation of SF+5 , the dominant SFx fragment will be SF5, in accordance with the conclusion of Kline [24], Anderson et al [26] and the calculations of Van Brunt et al [30]. It is likely that the paths resulting in smaller fragments, e.g. SF2 and SF, contribute to the second peak of the cross section data for the total dissociation. These paths were not included in the reaction set as their thresholds
were higher (>19.5 eV) than the rest of the paths as well as in an effort to keep the reaction set simpler.
Concerning the single-step dissociations of SF6, another question is whether these reactions are a source of F2. Iio et al [16] estimated the thresholds for the single-step dissociations of SF6 into neutral fragments both including and neglecting F2 as a product. While neglected in most of the works [24–27, 30], F2 is considered as a product in the work of Riccardi et al [17]. By neglecting F2 as a product of SF6 dissociation we may underestimate the F2 density. However, we think that this reaction cannot alter the main discharge characteristics as the main products of SF6 neutral dissociation are SF5 and F (reaction (G1)).
Concerning the electron impact dissociation of SFx (x < 6) radicals, we considered dissociation into a neutral fragment with one F atom less ((G4) and (G5)) following most of the published works [17, 24–27]. The cross sections and thresholds for all these reactions were considered equal to each other [24, 25] and equal to that of SF6 dissociation into SF5 [24]. Anderson et al [26] assumed that the cross section data of SFx dissociation had a threshold behaviour and calculated the rate coefficients based on the strength of SFx –F bond, while Rauf et al [20, 27] used unpublished cross sections from Adamson and Dementiev.
Concerning the dissociative ionization of SF6, the production of SF+5 , SF+4 and SF+3 is taken into account ((G8)–(G10)) by using cross section data from Stanksi and Adamszyk [15]. The production of lighter ions is not considered as the respective thresholds are greater than 20 eV. The cross sections for the ionization of SFx radicals (x = 3,4,5) were taken from the work of Tarnovsky et al [14]. Both SF+4 and SF+3 are considered to result from ionization of SF4 [12, 17, 26]. Not knowing the exact cross sections, we divided the total ionization cross section data of SF4 by 2 and used them for each of reactions (G13) and (G14).
As the recombination reactions between neutral species were considered to be important [24, 26], a set of this type of reactions is also included in the reaction set ((G35)–(G41)). The equation reported by Ryan and Plumb [25] for the fall-off region is used for the calculation of the pertinent coefficients of most of the reactions, while the rest are coming from Anderson et al [26].
The importance of ion–molecule reactions, even if they were not included in previous studies, was noted by several works [51, 52]. Even if several ion–molecule reactions have been reported [50, 52–54], due to lack of the values of the pertinent rate coefficients, only one ion–molecule reaction is included in the set of table 1 (G50). This reaction and other ion–molecule reactions affect the positive ion composition in the plasma.
Finally, in an intermediate version of the model, the formation of the stable dimer S2F10 was included in the gas phase recombinations following the conclusions and measurements of several works [30, 54–56]. The addition of S2F10 in the reaction set was checked if it accounts for the loss of SFx radicals shown by the experimental data (see section 3). Nevertheless, we managed to predict the experimental data without the formation of S2F10. In addition, as the cross
7