

книги / FISMA and the risk management framework the new practice of federal cyber security
..pdfFriction, damage and stick-slip in the scratching ofpolymers |
77 |
600
500
z 400
.s
~ 300
0
>
?: 200
100
00
Normal Load = 882.2 mN
Driving Speed = 20 f!m/sec
200 |
400 |
600 |
800 |
Time (sec)
Fig. 20. Horizontal force, k(V0 t - x), measured by the load cell [46].
During scratching, the horizontal force measured by the load cell can be represented by k(Vot - x), where (V0t - x) is the real extension of the spring being stretched,/ is the force needed to deform plastically the material in front of the indenter if is referred to as the scratch force hereafter). As mentioned before, the actual normal load during scratching was measured by a balance on which the slider was positioned. Even though it was a dead load system, there appeared some variation in normal load, about 2%, due to the vertical movement of the indenter.
A plot of the horizontal force, k(V0t- x), versus time for a scratching process is shown in Fig. 20, revealing a sawtooth wave form characteristic of stick-slip behavior. It was observed that the scratching motion proceeded by jerks instead of a smooth path, that is, scratching motion is uneven, consisting of stick and slip stages. During the stick stage, there is no relative motion between the indenter and sample. The time of the stick (tens of seconds, depending on the normal load and driving speed) was much longer than that of the slip (< 1s, usually is in the order of 1110 of a second), and the speed of slip was much higher than the driving speed of the step motor.
The variation of horizontal force, k(V0t - x), for a single slip stage is represented in Fig. 21, the curve being approximately symmetrical about its point of inflection. In principle, the computer records enough information so that the real scratch distance (x), velocity (V), and scratch force
(f) at any instant during slip can be found. The static friction is equal to the restoring force of the spring just before slip. The scratch distance, x, calculated from the horizontal force, k(Vot- x), is also exhibited in Fig. 21. To find the velocity and acceleration, one may differentiate the distance-time data once and twice, respectively. If the derivatives are calculated by the numerical process of taking differences, the errors of measurements in the original data are considerably magnified by each differentiation. Especially, the scattering of points of acceleration so calculated is of the same order of magnitude as the acceleration itself Consequently some method of treating the data had to be used. The actual procedure followed was curve-fitting the original data. The results are affected by an error in the determination of the instant when the slip motion begins, which, unfortunately, is difficult to ascertain.

78 Scratching of materials and applications
Figure 22 (a) represents the scratch velocity versus time during slip, which is obtained by fitting the horizontal force data first and then taking differentiation. During the slip stage, the scratch velocity increases from zero to a maximum and then decreases to zero to enter the stick stage again. It can be seen that the velocity profile seems symmetric and the maximum velocity, Vmax. attained in the point of inflection can be more than 103 times higher than the driving speed of the motor. If the velocity is plotted against the scratch distance, as shown in Fig. 22 (b), it is clear that for most of the scratch distance, the velocity is within (0.5 - 1) Vmax , i. e. the slip is all fast except at the beginning and end.
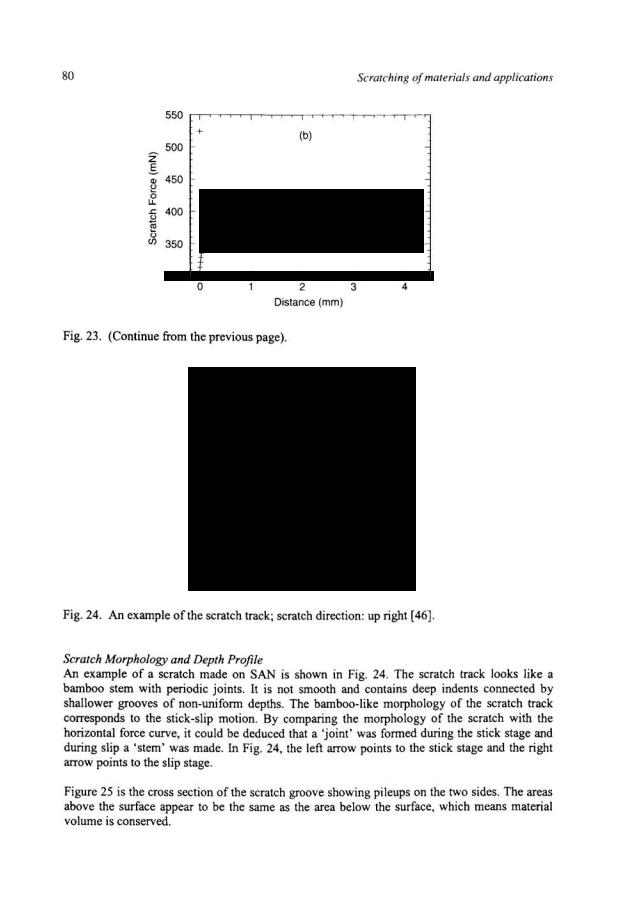
By twice differentiating the horizontal force, k(V0 t - x), with respect to t, the acceleration and then the scratch force (j) through Eq. (9) can be calculated. Fig. 23 (a) is a plot of/against time. Several facts are striking. At the beginning of slip, the scratch force drops abruptly from the static to a kinetic value - in fact, no intermediate value was found by this method. The scratch force does not return to its starting value when the slider comes momentarily to rest at the end of slip, but instead increases somewhat. However, it does not return to the beginning value before the slip stage (at the end of stick stage) either. This is interpreted by the increase of adhesion between the indenter and the material during the stick stage. Iffis plotted againstx, as shown in Fig. 23 (b), the scratch force, quite surprisingly, is almost constant for most of the distance in the slip stage.
|
|
|
|
|
|
|
.... |
|
|
|
|
|
|
|
|
.· |
.·.·· |
|
4 |
450 |
|
|
|
|
|
|
|
|
|
z |
|
|
|
|
|
|
|
|
|
.s 400 |
|
|
|
|
|
|
|
|
|
>< |
|
|
|
|
|
|
|
|
|
g 350 |
|
|
|
|
|
|
|
|
|
?< |
|
|
|
|
|
|
|
|
|
300 |
|
.· |
|
|
|
|
|
|
|
|
|
|
|
|
|
|
|
|
|
250 |
|
.·.· |
|
|
|
|
|
|
|
|
|
|
|
|
|
|
|
|
|
|
|
0.04 |
|
0.08 |
0.1 |
|
0.12 |
0.14 |
|
0.02 |
0.06 |
|
|||||||
|
|
|
Time (sec) |
|
|
|
|
|
|
Fig. 21. The time traces of horizontal force, k(V0 t -x), and scratch distance (X). Normal load= 882.2 mN and driving speed= 20 !lrnfs [46).

Friction, damage and stick-slip in the scratching ofpolymers |
79 |
40
u
(])
~ 30
s
~ 20
·g
~10
+ |
+ |
-+ |
+ |
o~~_L~~~~~~~~LL~-L~~~
u
s~
0 |
0.02 |
0.04 |
0.06 |
0.08 |
0.1 |
0.12 |
0.14 |
Time (sec)
40
30
+
+
+
2 3 4 Distance (mm)
Fig. 22. Scratch velocity during slip: (a) versus time, (b) versus scratch distance. Normal load= 882.2 mN and driving speed= 20 f.lm/s [46].
+ |
(a) |
z 500
s
Q) 450
~
0
u.
.c 400
B
~
(J
(/)350
0 |
0.02 |
0.04 |
0.06 |
0.08 |
0.1 |
0.12 |
0.14 |
Time (sec)
Fig. 23. Scratch force during slip: (a) versus time, (b) versus distance. Normal load= 882.2 mN and driving speed = 20 f.lm/s [46].

Friction, damage and stick-slip in the scratching ofpolymers |
81 |
Figure 26 is the center-line profile ofthe scratch track. It is noticeable that the depth of the stem was not uniform. At the joint, the depth was the deepest because the time of stay of the indenter at one location was much longer than any time during the slip stage so a static indentation was made during the stick stage. As soon as slip commenced, the indenter climbed out from the indent and made a stem.
As described above, the scratch velocity during slip can be obtained by fitting the horizontal force data first and then taking differentiation. It is interesting to see what is the correlation between the scratch depth and slip velocity. Because the scratch depth recovered to some extent as the indenter moved away, the depth h can be calculated only from the groove width and the shape of the indenter. Since the in situ groove width during slip was not available, and earlier studies [43, 44] of indentation recovery showed that the depth recovered much faster than the width, the residual groove width was then used in the calculations. The measured (residual) depth is found only about 40% of the calculated one, showing a large extent of indentation recovery.
-...
C) |
|
|
|
|
g---- |
+------- |
~ |
-------+---- |
~ |
..... |
50 |
75 |
100 |
|
I |
|
Jllll
Fig. 25. Cross-section profile ofthe scratch groove in the middle of the slip stage [46].
8 |
|
|
|
|
|
|
... |
|
|
|
|
|
|
o+ |
|
----------------------------- |
|
|
~ |
|
0 |
25 |
so |
75 |
100 |
|
|
|
||||||
Fig. 26. Center-line profile along the scratch track; scratch direction: right [46].

82 |
Scratching of materials and applications |
--y = 2.667- 0.6913x R= 0.92075
2.5+
2 |
|
|
|
|
|
E |
|
|
--+--- Calculated |
||
~ |
|
|
|||
a 1.s |
|
|
|||
Q) |
• • |
|
|
• |
Measured |
0 |
•• • •• • |
|
|
|
|
|
•••• |
• •• |
|||
|
|
• |
• • |
|
|
|
|
|
|
• • |
• ••j |
0.5Normal Load= 75.95 mN Driving Speed = 10 ~m/sec
0 ~~~~J_~~~_L~~~~~~~~
0 |
0.25 |
0.5 |
0.75 |
Velocity (mm/sec)
Fig. 27. Scratch depth versus velocity during slip. Normal load= 75.95 mN, driving speed= 10 f.lm/S (46).
Figure 27 is a plot showing the calculated depth (or the actual depth during scratch) gradually decreases with the increase of velocity. It appears that the shallower the groove depth, the faster is the scratch velocity. Let us consider a very small distance ~ along the scratch path, the time period needed for the indenter to go over this distance is ~IV where V is the velocity of the indenter. Analogous to static indentation, the scratch depth is expected to increase with the time period ~IV, i.e. to decrease with increasing velocity.
SUMMARY
For uncrosslinked PnBA coatings, the horizontal force increases with increasing the applied normal load and begins with a residual value at zero normal load. The relation between the horizontal force and normal load can be understood by finite element computation based on the JKR theory. With increasing driving speed, the horizontal force shows a power relation with speed indicating a rate process. For crosslinked PnBA coating, the horizontal force approaches zero at zero normal load. Below a critical normal load, which depends on the thickness of the coating, the crosslinked coating recovers elastically after being scratched. Above the critical load, the coating is damaged and, depending on the coating thickness, shows two distinct damage mechanisms.
During the scratching of PDMS coatings, the contact area is essentially due to elastic deformation by the normal load, and the horizontal force appears proportional to the contact area. Above a critical normal load, which increases with coating thickness, the coating is damaged due to a combination of delamination at the coating/substrate interface and throughthickness cracking. When the coating is damaged, there is an increase in the friction coefficient,
Friction, damage and stick-slip in the scratching ofpo/nners |
83 |
and the horizontal force exhibits large fluctuations. The critical normal load increases with the scratching speed; this implies that time is needed to nucleate damage.
The scratch velocity of the indenter in the slip stage is approximately symmetric about its point of inflection that is in the center of the slip distance. The kinetic scratching force remains rather constant for most of the distance traveled in the slip stage. The scratch groove made during slip shows a non-uniform depth, which varies with velocity; the faster the scratch velocity, the shallower is the groove depth.
REFERENCES
I.Holmberg, K. and Matthews, A. (1994). Coatings Tribology. Elsevier, Amsterdam.
2.Bull, S. J. (1991) Surf. Coat. Techno/. 50, 25.
3.Bull, S. J. (1997) Tribal. Int. 30, 491.
4.Johnson, K. L., Kendall, K. and Roberts, A. D. (1971) Proc. R. Soc. London Ser. A 324, 301.
5.Hertz, H. (1882) J. Reine. Angew. Math. 92, 156.
6.Hertz, H. (1896). Miscellaneous Papers. Macmillan, London.
7.Greenwood, J. A. and Tabor, D. (1958) Proc. Phys. Soc. 71,989.
8.Moore, D. F. (1975). Principles and Applications ofTribo/ogy. Pergamon Press, Oxford.
9.Khurana, A. (1988) Phys. Today 41, 17.
10.Gao, C., Kuhlmann-Wilsdorf, D. and Makel, D. D. (1994) Wear 173, I.
11.(a) Bowden, F. P. and Tabor, D. T. (1986). The Friction and Lubrication of Solids.
Clarendon Press, Oxford.
(b) Bowden, F. P. and Tabor, D. T. (1982). Friction, An Introduction to Tribo/ogy.
Krieger Publishing Company, Florida.
12.Gao, C., Kuhlmann-Wilsdorf, D. and Make!, D. D. (1993) Wear 162-164, 1139.
13.Heslot, F., Baumberger, T., Perrin, B., Caroli B., and Caroli, C. (1994) Phys. Rev. E 49, 4973.
14.Li, K., Ni, B. Y. and Li, J. C. M. (1996)J. Mat. Res. 11, 1574.
15.Starmer, P. H. and Wolf, F. R. (1985). In: Encyclopedia of Polymer Science and Engineering, pp. 306, Mark, H. F., Bikales, N. M., Overberger, C. G., Menges, G. and Kroschwitz, J. I. (Eds). Wiley, New York.
16.Zhang, S. L., Tsou A. H. and Li, J. C. M. (2002) J. Polym. Sci. Part B: Po/ym. Phys. 40,
585.
17.Zhang, S. L., Tsou A. H. and Li, J. C. M. (1998) Mat. Res. Soc. Symp. Proc. 522, 371.
18.Zhang, X. Z. (2001). PhD Thesis, University of Rochester, Rochester, NY.
19.Li, J. C. M. (2001) Mat. Sci. Eng. A 317, 197.
20.Roberts, A. D. (1977) J. Phys. D Appl. Phys, 10, 1801.
21.Moore, D. F. (1972). The Friction and Lubrication ofElastomers. Pergamon, Oxford.
22.Grosch, K. A. (1963) Proc. R. Soc. London Ser. A 274,21.
23.Williams, M. L., Lande!, R. F. and Ferry, J.D. (1955)J. Am. Chern. Soc. 77,3701.
24.Sneddon, I. N. (1965) Int. J. Eng. Sci. 3, 47.
25.Benjamin, P. and Weaver, C. (1960)Proc. R. Soc. London. Ser. A 254, 163.
26.Weaver, C. (1975) J. Vac. Sci. Techno/. 12, 18.
27.(a) Burnett, P. J. and Rickerby, D. S. ( 1988) Thin Solid Films 157, 233.
(b) Burnett, P. J. and Rickerby, D. S. (1987) Thin Solid Films 154,403.
28.Laugier, M. T. (1984) Thin Solid Films 117,243.
84 |
Scratchinf? of materials and applications |
29.Steinmann, P. A., Tardy, Y. and Hintermann, H. E. (1987) Thin Solid Films 154, 333.
30.Von Stebut, J., Rezakhanlou, R., Anoun, K., Michel H. and Gantoils, M. (1989) Thin Solid Films 181, 555.
31.Hedenqvist, P., Olsson M., Jacobson, S. and Soderberg, S. (1990) Surf Coat. Techno/.
41, 31.
32.Bethune, B. (1976)J. Mater. Sci. 11, 199.
33.Leu, H. J. and Scattergood, R. 0. (1988) J. Mater. Sci. 23, 3006.
34.Wu, T. W. (1991)J. Mater. Res. 6,407.
35.Ni, B. Y. and Le Faou, A. (1996)J. Mater. Sci. 31,3955.
36.Hamilton, G. M. and Goodman, L. E. (1966) J. Appl. Mech. 33, 371.
37.Lawn, B. R. (1967) Proc. R. Soc. London Ser. A 299,307.
38.Gupta, B. K. and Shushan, B. (1995) Thin Solid Films 270,391.
39.Moore, G. and Kline, D. (1984). Properties and Processing of Polymer for Engineers.
Prentice-Hall, Englewood Cliffs, NJ.
40.Zhang, S. L., Tsou A. H. and Li, J. C. M. (2002) J. Polym. Sci. Part B: Polym. Phys. 40, 1530.
41.Schallamach, A. (1953) Proc. Phys. Soc. London Sect. B 66,386.
42.Kajiyama, T., Tanaka, K. and Takahara, A. (1997) Macromolecules 30, 280.
43.Chang, B. T. A. and Li, J. C. M. (1979) Scripta Metal!. 13, 51.
44.Chang, B. T. A. and Li, J. C. M. (1980)J. Mater. Sci. 15, 1364.
45.Rabinowicz, E. (1965). Friction and Wear ofMaterials. Wiley, New York.
46.Zhang, S. L. and Li, J. C. M. (2003) Mat. Sci. Eng. A 344, 182.
85
CHAPTER4
NANOSCRATCH AND INTERFACIAL FRICTION OF POLY(AMIDE) FIBRES
J. CAYER-BARRIOZ< 1l, D. MAZUYER< 11, A. TONCK< 11, Ph. KAPSA< 1l,
and A. CHATEAUMINOIS<21
(IJLaboratoire de Tribologie et de Dynamique des Systemes, UMR 5513, Ecole Centrale de Lyon, 36 avenue Guy de Collongue69130 Ecully FRANCE
(JJ Laboratoire de Physico-Chimie des Polymeres et des Milieux Disperses, UMR 7615, ESPCI, 10 rue Vauquelin75231 Paris FRANCE
E-mail :Juliette. Cayer-Barrioz@ec-lyon.fr
ABSTRACT
The analysis of the wear resistance of polymeric fibres requires a better understanding of both their abrasive scratch behaviour and their frictional response. These aspects have been investigated at the nanometre scale using the resources of a modified surface force apparatus. In an attempt to simulate abrasive wear losses, nanomachining experiments have been carried out which consist in the repeated scratching of a portion of the fibre surface by the rigid indenter. However, an analysis of the resulting surface topography indicated a significant plastic grooving of the fibre surface with no evidence of wear losses as it was observed at the macroscopic scale. Single pass nanoscratch experiments realised at various sliding speeds also allow discussing the relative contributions of both the material viscoplasticity and the tip/material local interactions on the frictional response. When the sliding speed was incrementally changed during a scratch experiment, it was observed that the associated friction variation was accommodated on a 50 nm distance, independently of the sliding speed.
KEYWORDS
Apparent friction, interfacial friction, nanoscratch, nanotribology, poly(amide) fibre
INTRODUCTION
Over the past years, the tribological behaviour of polymeric materials, and particularly their frictional response, has drawn a considerable interest. Bowden and Tabor [I] first tried to describe the friction phenomena by taking into account the mechanical contact and adhesion between microscopically rough surfaces. This model, developed for perfectly elastic - plastic materials, has been refined through the years and introduced into statistical physics. Such a statistical model was recently used to describe polymer - polymer friction [2]. However, no effective and comprehensive model for the evolution of the friction force with distance or time has been advanced to date. In order to overcome the difficulties inherent to macroscopic multi - asperity contacts, model experiments that attempt to simulate the friction induced by a single
86 |
Scratching of materials and applications |
asperity contact are often considered [3]: for instance, nanoscratching experiments have long been recognized as a potential route to mimic and characterize in a more controlled manner the deformation and frictional response involved in asperity engagements [3] since this method does not require statistical models.
The early description of Bowden and Tabor [1] assumed that the tangential load necessary to move a grooving tip laterally under a constant normal load is the sum of two separate components, namely an interfacial shear component (often denoted to as the 'adhesive' component of friction) and a bulk ploughing or deformation term. The former is associated with the shearing of the adhesive junctions formed between contacting microasperities within the true contact, while the latter results from mechanical losses induced by the interpenetration of the surface irregularities [4]. Therefore, during a nanoscratch experiment at constant sliding speed, the apparent friction coefficient, ll•PP• can be defined as:
(1)
where Fx is the tangential load, Fz is the normal load,
Fadh is the 'adhesive' component, Fploughing is the 'ploughing' component,
Hr and HN are respectively the tangential and normal hardness [5-6],
Ar and AN are the projected contact areas seen in a direction respectively normal and parallel to that of the relative motion of the indenter [5-6].
The deformation term remains difficult to estimate since most existing models describing the scratch properties of materials do not take into account the viscoelastic and/or viscoplastic effects which can be significant in the case of polymeric materials [1, 6-7]. The analysis of this component is critically dependent upon the evaluation of the hardness and also upon the estimate of the size and shape of the contact area. The true contact area between the moving tip and the material is generally considered to be the front half of the part of the tip in contact with the surface but is somewhat difficult to predict since it clearly depends on the material and on the existence of elastic recovery [8]. Calculi presented in the Appendix confirm that the friction component due to ploughing is function of geometric aspects and on the material. Lately, this led to the development of in situ visualization devices [8].
The interfacial shear term results from intricated effects of speed, contact pressure and time taking place near the interface. These effects, strongly correlated to the specific rheological response of the confined interfacial layer of the material, may lead to transient phenomena [9- 13].
The frictional work is assumed to be dissipated in two distinct regions: an interface zone and a subsurface zone. The processes occurring in one are considered not to influence those occurring in the other [ 14-15]. Therefore, the two components are supposed to be non interactive. Recent scratching experiments using the resources of in situ visualization demonstrated, however, that strong interactions between the interface and ploughing components can be involved during the scratching of viscoelastic polymers [8]. Such effects are especially demonstrated through the investigation of the dependence of the shape and size of the contact area on parameters such as sliding speed or temperature. Nevertheless, in situations such as scratching, extensive bulk