


5
Hepatic Pseudolesions
CONTENTS
5.1 Pathophysiologic Background
5.1.1 Anatomic Variants of the Hepatic Circulation
5.1.2 Vascular Abnormalities
5.2 Parenchymal Pseudolesions
5.2.1 Focal Fatty Liver
5.2.2 Focal Spared Areas in Fatty Liver
5.2.3 Inflammatory Pseudotumors
5.2.4 Peliosis Hepatis
5.2.5 Confluent Hepatic Fibrosis
5.2.6 Segmental Hypertrophy
5.2.7 Parenchymal Compression
5.3 Vascular Pseudolesions
5.3.1 Transient Hepatic Attenuation Differences
5.3.2 Vascular Malformations
5.1
Pathophysiologic Background
The liver uniquely receives a dual blood supply; approximately 1000-1200 ml/min of blood arrives via the portal vein and approximately 400 ml/min arrives via the hepatic artery. In a non-cirrhotic liver, blood perfusion occurs at pressures of approximately 7 mmHg and 100 mmHg, via the portal vein and hepatic artery, respectively. Arterioportal parenchymal perfusion demonstrates the degree of reciprocity of the arterial and portal venous contributions by virtue of vascular flux through dynamic microcirculatory arterioportal shunts (APS), largely at the level of the portal triad by transplexal, transvasal, or even transtumoral routes [20, 24]. These shunts can transiently open under the influence of angiogenic modulators but are frequently related to a pathology that either
compromises portal flow or increases arterial perfusion. APS can open to a further extent in response to significant portal blood flow reduction or stoppage, which in turn results in a compensatory increase of the arterial flow through the corresponding liver segments.
Connections between the intrahepatic vascular systems are not restricted to arterioportal communication but may also occur between the portal vein and the hepatic or systemic veins, as seen in conditions such as portal hypertension.
Transsinusoidal shunts are governed by an arteriolar inlet sphincter under the influence of angiogenic factors such as vascular endothelial growth factor (VEGF) and angioproteins. These shunts occur in Budd-Chiari syndrome, or may arise for no apparent reason or in response to focal infection or nodules of disease that compromise the portal perfusion of the subtended liver.
The peribiliary plexus or transplexal route is the most prominent venous system, and is composed of vessels that run around the lobular ducts. This system plays an important role when the portal vein is compromised.
Transvasal plexus often occurs in conjunction with peribiliary shunting and via the vasa vasorum of the portal vein. It most commonly occurs in the setting of portal vein occlusion or in cases of invasive hepatocellular carcinoma (HCC) [20].
Small areas of liver tissue may be supplied by another venous system, the “third inflow” which comprises aberrant veins that enter the liver directly, independently of the portal venous system. Such veins communicate with intrahepatic portal branches to various degrees and lead to focally decreased portal perfusion. However, little overall change in the hepatic arterial perfusion is seen. Because this hemodynamic state is persistent, focal metabolic changes are occasionally observed, typically as sparing in the fatty liver or as accumulations of fat [20].

152 MRI of the Liver
5.1.1
Anatomic Variants of the Hepatic Circulation
Anatomic vascular variants of the hepatic circulation may involve the hepatic artery, the portal vein, and the hepatic veins, and may occur in the following manner:
A)The hepatic artery may have many collateral vessels including the pancreatic-duodenal arteries, the gastro-duodenal artery, and the phrenic inferior right artery. Collateral routes by aberrant hepatic arteries may originate from the superior mesenteric artery, the left gastric artery or by extrahepatic collateral arteries, such as the left gastroepiploic artery, the gastroduodenal artery, and the right gastric artery. Outside the celiac trunk, collateral flow may occur via the inferior phrenic artery [36].
B)The portal vein has variants and collateral vessels. Frequently, portal vein variants result in a “third inflow” in which aberrant veins that are not connected with the portal vein system enter the liver directly. These aberrant veins, which are not derived from the gut venous drainage, are poor in nutritional factors. The third inflow may involve the cystic vein, which drains the gallbladder bed, and the parabiliary venous system, which is within the hepatoduodenal ligament just anterior to the main trunk of the portal vein. The parabiliary venous system collects venous blood from the head of the pancreas, the distal part of the stomach, and the biliary system near the gallbladder [13, 32]. These veins usually join the main trunk of the portal venous system’s major branches, but occasionally enter the liver directly around the porta hepatis, which sometimes results in isolated perfusion.
The epigastric-paraumbilical venous system is another variant of the portal vein and consists of small veins around the falciform ligament that drain the venous blood from the anterior part of the abdominal wall directly into the liver. These veins are roughly divided into three subgroups: the superior and inferior veins of Sappey that drain the upper and lower portions of the falciform ligament, respectively, and the vein of Burow [47]. When obstruction of the vena cava occurs, each of these veins may serve as collateral channels for blood flow into the liver.
C)There are numerous hepatic vein variants and accessories. Most hepatic vein variants drain directly into the inferior vena cava. These usually enter the vena cava on the right side both caudally and dorsally with respect to the level of the portal vein. The detection of these vessels is important in Budd-Chiari syndrome and
also for surgical planning, since they represent the main drainage route from the right liver lobe [47].
5.1.2
Vascular Abnormalities
Due to the interrelationship between different vessels, when individual vessels become compromised, this immediately changes the blood flow in surrounding vessels (Fig. 1).
5.1.2.1 Portal Vein Compromise
A decrease in portal blood flow may occur in response to thrombosis, stenosis, or to compression of the main portal trunk or peripheral intrahepatic branches. On dynamic computer tomography (CT) or magnetic resonance (MR) studies of the liver, the decreased portal blood flow leads to areas of parenchymal enhancement during the arterial phase, referred to as transient hepatic attenuation difference (THAD). This area of enhancement, representing increased compensatory arterial flow, is no longer visible during the subsequent portal venous phase due to rapid equilibration of contrast density. Potential clinical problems associated with THAD are that focal liver lesions may be obscured if they are located within the areas of hyperattenuation, and that the THAD areas themselves may be mistaken for hypervascular lesions if they have a round or oval shape.
THAD are frequently seen around liver ab-
Fig. 1. Liver vessels. Schematic representation of the inter-rela- tionship between different vessels in the liver, demonstrating changes in the blood flow when an individual vessel is compromised. (HA=Hepatic Artery, PV=Portal Vein, HV=Hepatic Veins)

5 • Hepatic Pseudolesions |
153 |
scesses or acute cholecystitis and these may develop as a result of increased arterial perfusion deriving from local hyperemia related to the inflammatory process itself and/or because of locally reduced portal flow due to parenchymal compression by the lesion. In cirrhotic and non-cirrhotic patients, THAD are typically fanor wedge-shaped and may be lobar, segmental, subsegmental, or subcapsular in location.
Another cause of reduced portal blood flow to the liver, especially at the periphery, is portal cavernoma [10].
5.1.2.2
Hepatic Artery Compromise
The hepatic arteries communicate with each other in the central portion of the liver and thus the blockage of these large arteries induces new routes of flow. However, acute obstruction of peripheral arterial flow does not induce recognizable changes in portal blood flow [43].
5.1.2.3
Hepatic Vein Compromise
When the hepatic vein is acutely obstructed, the portal vein becomes a draining rather than a supplying vein. The result is a compensatory increase in hepatic arterial flow as a result of functional portal flow elimination. Liver tumors may obstruct the hepatic vein, in which case prominent hepatic enhancement is induced at a site that corresponds to the area of obstructed hepatic venous drainage.
A reduction in the afferent blood flow via the hepatic vein is seen in Budd-Chiari syndrome. In the acute phase, the post-sinusoidal obstruction causes a severe reduction in the portal vein flow and a compensatory increase in the arterial flow delivered through the hepatic artery. Since blood flow is not able to perfuse the more peripheral liver areas properly, and because there is a pressure gradient between the arterial vessels and liver veins, functional intrahepatic APS develop, that may ultimately lead to complete flow reversal within the portal vein. In the latter phases of liver enhancement, the appearance of the parenchyma is characterized by stasis. This imaging finding is also seen in right side cardiac failure, and is ascribable to the same hemodynamic effects.
In the chronic phase of Budd-Chiari syndrome, an intrahepatic network of venous collateral vessels is prominent, which develops to bypass the obstruction. These abnormal vessels are more evident at the periphery, and are most prominent around the caudate lobe, due to its separate autonomous venous drainage [31].
5.2
Parenchymal Pseudolesions
Hepatic pseudolesions are non-neoplastic abnormalities which may be sub-divided into parenchymal pseudolesions and vascular pseudolesions. Parenchymal pseudolesions include focal fatty change, focal sparing, inflammatory pseudotumor, confluent fibrosis, pseudotumor hypertrophy and hepatic peliosis. Vascular pseudolesions, on the other hand, are non-neoplastic hepatic pseudolesions such as APS, THAD, and vascular abnormalities associated with Budd-Chiari syndrome.
Non-neoplastic abnormalities are clearly depicted with modern imaging techniques and arise principally due to blood flow abnormalities. These pseudolesions often occur focally and can be found in both cirrhotic and non-cirrhotic livers. The main clinical difficulty is to detect and discriminate these non-neoplastic lesions from benign and malignant hepatic neoplasms [32].
5.2.1
Focal Fatty Liver
Fatty liver infiltration is a common, metabolic complication of a variety of toxic, ischemic and infectious insults to the liver, such as obesity, diabetes mellitus, alcoholic liver disease, malnutrition, and chemotherapy. Other causes include hyperalimentation, inherited metabolic disturbance, inflammatory bowel disease, severe hepatitis, endogenous and exogenous steroid use, and pregnancy [1]. Generally, fat is deposited in response to different metabolic changes, such as increased hepatic synthesis of fatty acids (ethanol), decreased hepatic oxidation or utilization of fatty acids (carbon tetrachloride, tetracycline), impaired release of hepatic lipoproteins (steroids), or excessive mobilization of fatty acids from adipose tissue (alcohol, steroids). The prevalence of focal fatty infiltration of the liver increases significantly with advancing age; whereas it is uncommon in infants and young children, it is present in roughly 10% of the adult population [23].
There are both diffuse and focal forms of fatty liver infiltration. Approximately 30-40% of cases occur focally, either as solitary areas (10% of cases), or as multiple areas with a more widespread distribution (20-30% of cases). Most cases of fatty liver infiltration are of the diffuse type with a segmental, lobar, or irregular distribution. A common site of fatty liver infiltration is the ventro-medial portion of the medial segment adjacent to the falciform ligament [6]. Portal flow decrease leading to hepatic nutritional ischemia is a common finding at this site and it is this decrease in portal flow that induces the deposition of fat. Frequently, sys-
154 MRI of the Liver
temic veins, such as the inferior vein of Saffey, supply this area in the absence of portal hypertension. Other common sites for the focal deposition of fat include subcapsular regions and the dorso-medial portion of the medial segment.When irregular fatty liver or multiple focal fat deposits are seen, they are typically distributed widely with no obvious relationship to vascular flow. In many cases fatty liver may be transient, appearing and disappearing comparatively rapidly. Moreover, it is often reversible with substance abstinence.
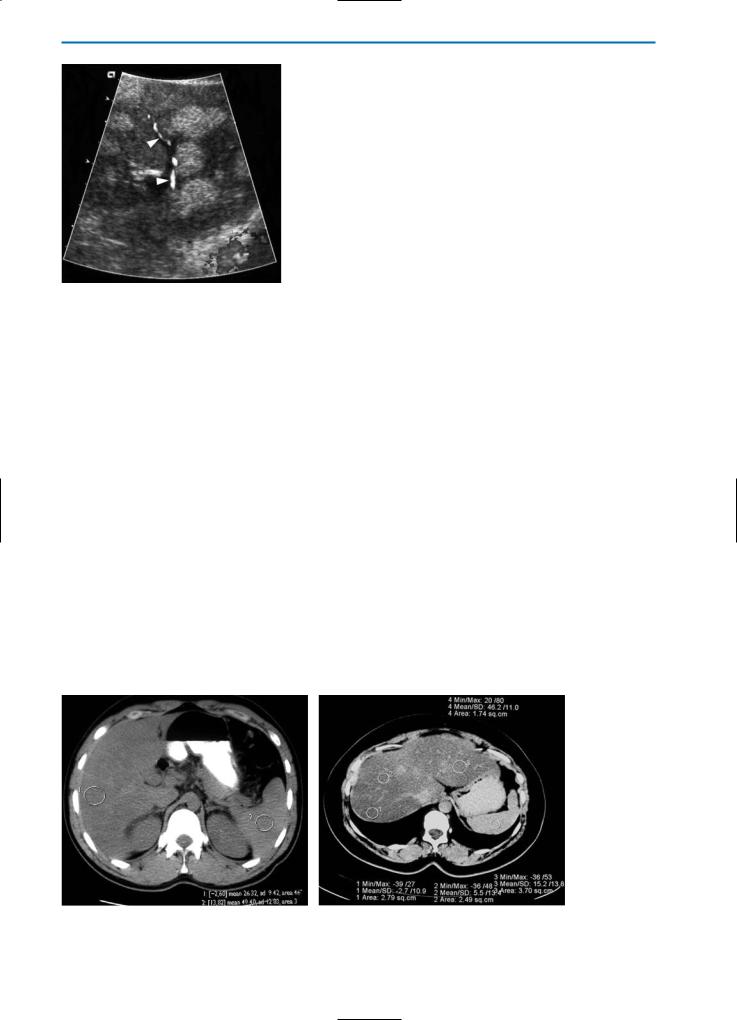
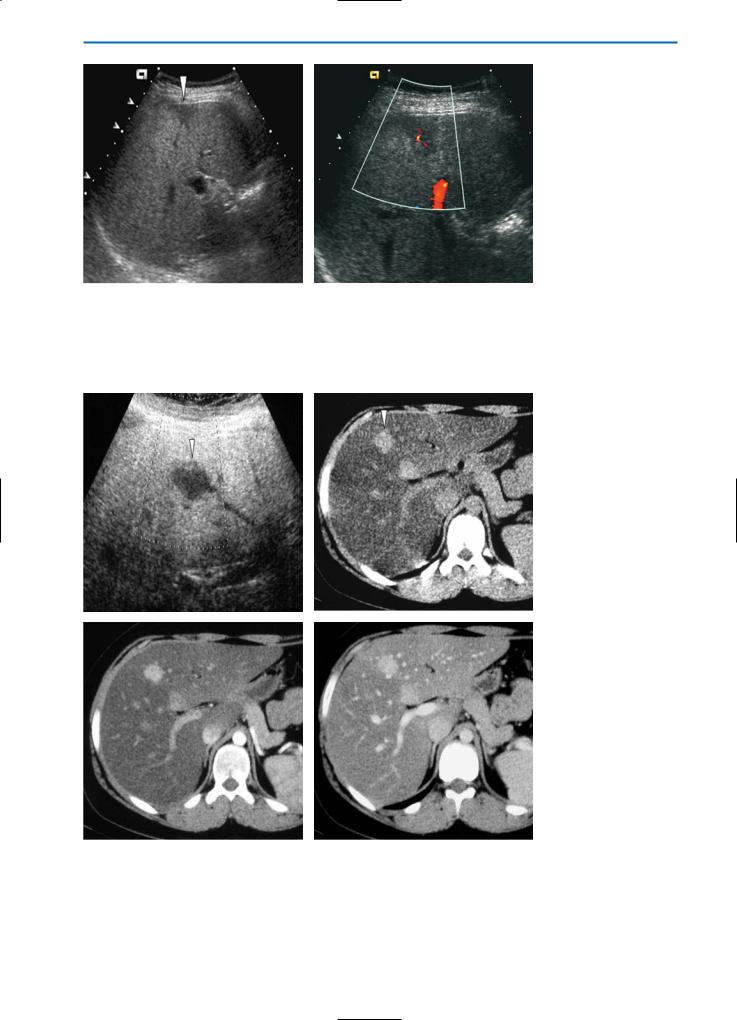
On ultrasound (US), a key indication for fatty liver infiltration is accentuation of the brightness of parenchymal echoes. While diffuse forms of fat infiltration typically have a homogeneous appearance, in some cases an extremely heterogeneous or pseudonodular appearance is noted, simulating diffuse nodularity. In the case of focal fatty infiltration, areas of fat deposition may be seen as solitary hyperechoic areas, multiple confluent hyperechoic areas, hyperechoic skip nodules, or irregular hyperand hypoechoic areas (Fig. 2). Color Doppler exam-
inations typically reveal no mass effect or vascular distortion (Fig. 3).
Some studies have examined the sensitivity and specificity of US for recognizing fat, as assessed on liver biopsy in patients suspected of having liver disease. Not surprisingly, the sensitivity of US imaging for the detection of fat increases with increasing degrees of steatosis. The mean sensitivity and specificity values vary from 60% to 90%, and from 80% to 95%, respectively. Unfortunately, US is not able to differentiate simple steatosis from non-alcoholic steatohepatitis, both of which may co-exist [17, 22].
On CT, the attenuation of the normal liver is generally 50-70 Hounsfield units (HU). Increased hepatic fat leads to a reduction of the mean hepatic attenuation.Whereas in mild cases the CT attenuation of the liver might approximate that of the spleen, in advanced cases the liver may appear particularly hypodense, albeit less dense than the portal and hepatic veins (Fig. 4). All forms of liver fat deposition (diffuse, lobar, irregular, and focal dis-
a |
b |
c |
d |
Fig. 2a-d. Focal fatty liver on US. On US examinations, focal fatty areas in the liver may appear with different patterns: (a) as hyperechoic nodules (arrows), (b) as multiple, confluent hyperechoic lesions (arrowheads), (c) as hyperechoic skip nodules (arrowheads), and finally (d) as irregular hyper- (asterisk) and hypoechoic areas (arrowheads)
5 • Hepatic Pseudolesions |
155 |
Fig. 3. Focal fatty liver on color Doppler US. On color Doppler evaluation, a vascular structure (arrowheads) courses, without distortion, between the hyperechoic nodules that represent focal fatty infiltration
tribution) are detectable on CT (Fig. 5). On unenhanced CT a diffuse distribution is seen as a general decrease of attenuation throughout the organ. Conversely, focal depositions of fat are identifiable as low-density, poorly demarcated, spherical or non-spherical areas that show no mass effect and which have a central core of inconspicuous hepatic tissue of normal density. However, multifocal fatty liver disease that simulates multiple lesions may also be seen (Fig. 6) [25].
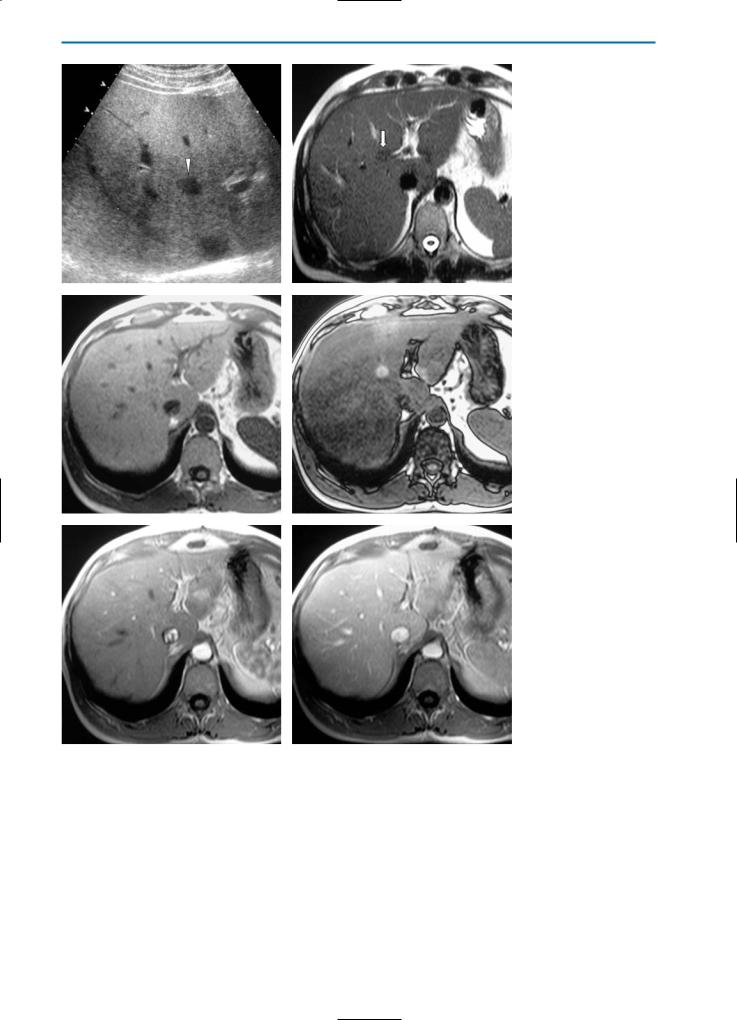
On unenhanced T1and T2-weighted MR imaging, fat deposition is typically characterized by slight hyperintensity relative to the normal liver parenchyma. Whereas conventional spin-echo sequences are relatively insensitive to fat deposition, the use of short tau inversion recovery (STIR) or other fat-suppression techniques may reveal the
presence of fat deposition as areas of lower signal intensity. On the other hand, possibly the best imaging technique to detect and discriminate intracellular fat is chemical-shift imaging. On in-phase images, the signals from fat and water are additive, while on opposed-phase images the fat signal is subtracted from the water signal. Lesions or areas containing fat and water therefore show a loss of signal intensity on opposed-phase images when compared with in-phase images (Fig. 7).
On T1-weighted images acquired during the arterial phase of contrast enhancement after the bolus injection of a gadolinium contrast agent, focal fat depositions generally appear as isointense or slightly hypointense compared to the surrounding liver parenchyma, depending on the degree of steatosis (Fig. 8). Conversely, during the liver-spe- cific hepatobiliary phase after Gd-BOPTA the typical appearance of focal fat depositions is slightly hypointense compared to the normal liver. This occurs because of “hepatocyte ballooning” which impedes the ability of the otherwise normal hepatocytes to take up Gd-BOPTA. This is particularly apparent on opposed-phase chemical shift imaging (Fig. 9).
With regards to diffuse fatty liver, this is typically seen during the liver-specific hepatobiliary phase after Gd-BOPTA administration, as a marked homogeneous increase in liver parenchyma signal intensity.
The appearance of focal fat areas on T2-weight- ed images after the administration of superparamagnetic iron oxide (SPIO) contrast agents is dependent on the Kupffer cell presence in the area of fatty change. Whereas some reports have suggested that fatty areas are not visible because of the overall marked decrease in signal intensity after SPIO accumulation [28], other studies have shown
a |
b |
Fig. 4a, b. Focal fatty liver on CT. Pre-contrast CT scans show that in moderate forms of focal fatty liver (a) the ROI values of the liver are lower than those of the spleen. Conversely, in advanced focal fatty liver (b) the liver is markedly hypodense with ROI values near 0 HU. Note that in advanced focal fatty liver, vessels are seen as hyperdense compared with normal liver tissue
156 MRI of the Liver
a |
b |
c |
d |
e |
f |
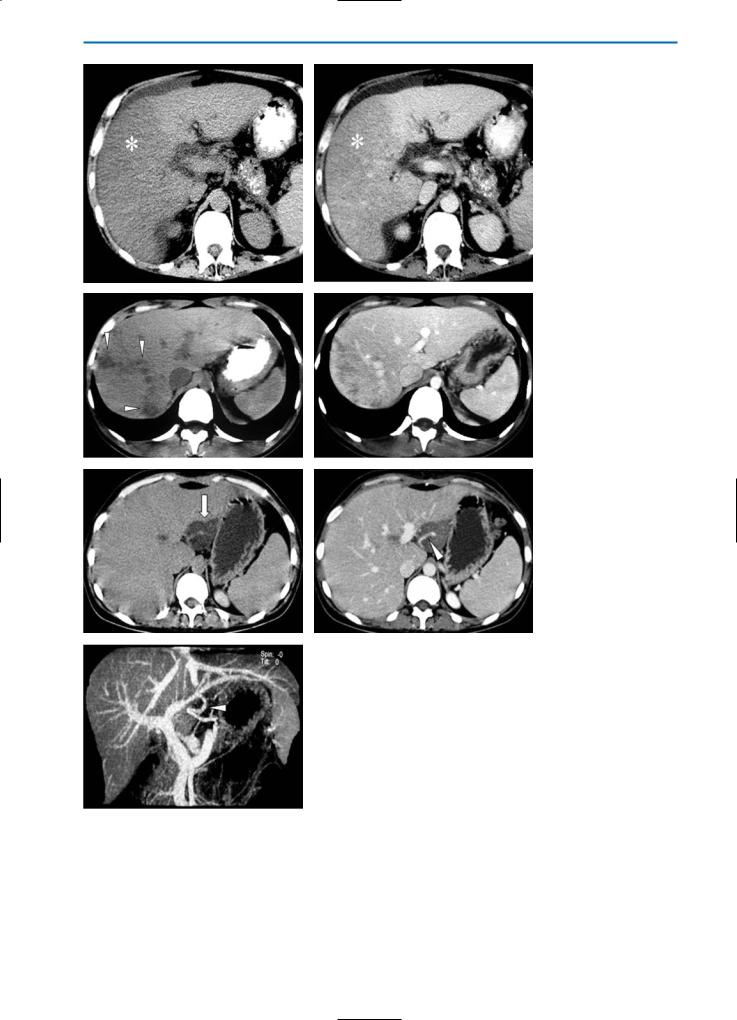
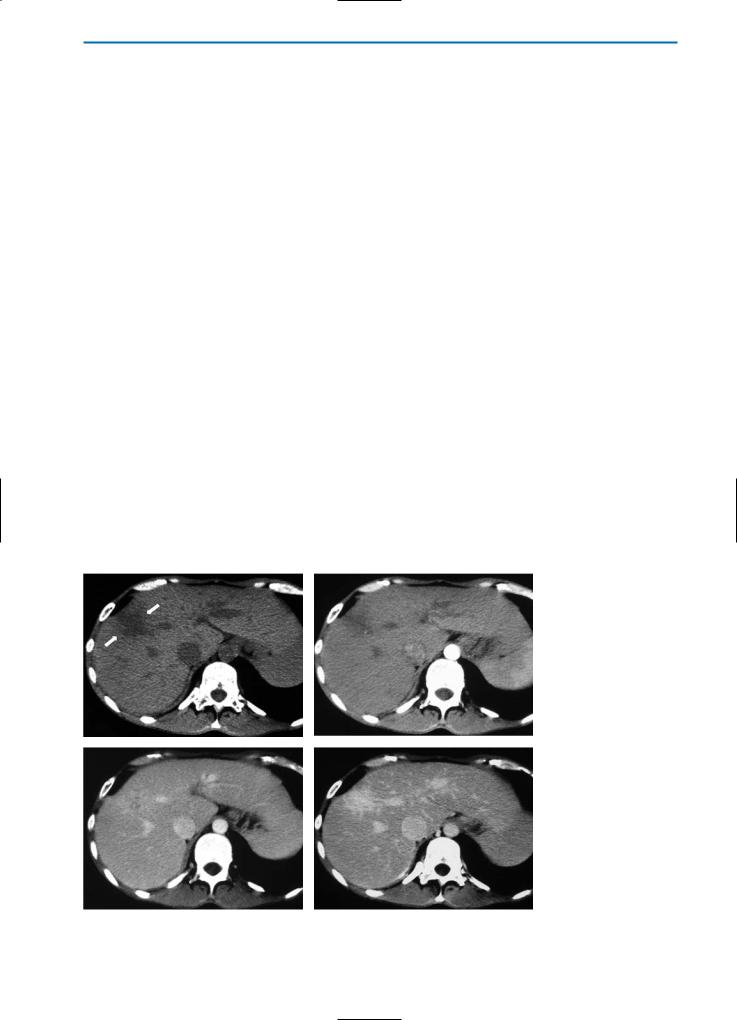
Fig. 5a-g. Focal fatty liver on CT. Fatty liver with lobar distribution (a, b) is represented by a large pseudolesion (asterisk) on the pre-contrast CT scan (a) that appears slightly hypodense after contrast medium administration (b). In focal fatty liver with irregular distribution (c, d) numerous small, ill-defined, hypodense nodules (arrowheads) on the pre-contrast scan (c) demonstrate heterogeneous enhancement in the portal venous phase after contrast medium administration (d). Fatty liver with a focal distribution (e-g) is characterized by a well-defined hypodense nodule (arrow) on the pre-contrast examination (e) which does not show significant enhancement after
gcontrast medium administration (f, g). Note the presence of an aberrant vessel within the pseudolesion (arrowhead)

5 • Hepatic Pseudolesions |
157 |
a |
b |
c |
d |
Fig. 6a-d. Multifocal fatty liver. On the US examination (a) multiple ill-defined, slightly hyperechoic nodules are detected (arrows). The corresponding pre-contrast CT scan (b) reveals numerous, ill-defined, slightly hypodense areas (arrows), which do not show significant enhancement during the arterial (c) and portal venous (d) phases after contrast medium injection. Note some vascular structures within the focal fatty areas (arrowheads in d)
a |
b |
c |
d |
Fig. 7a-d. Diffuse fatty liver. On the pre-contrast HASTE T2-weighted image (a) and the GRE T1-weighted “in-phase” image (b) the signal intensity of the liver is homogeneously increased. Conversely, on the GRE T1-weighted “out-of-phase” image (c) the signal intensity is markedly and characteristically decreased. GRE T1-weighted fat suppressed sequences (d) are not sufficiently sensitive to small quantities of fat, and so the liver appears hyperintense as compared with the spleen
158 MRI of the Liver
a |
b |
c |
d |
e |
f |
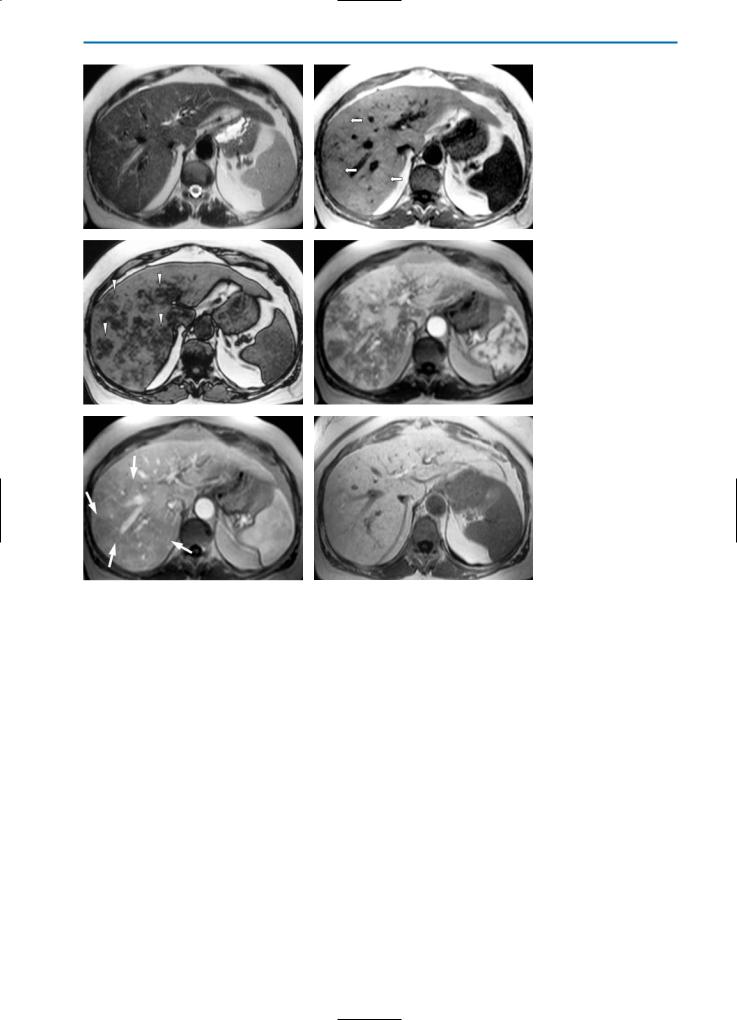
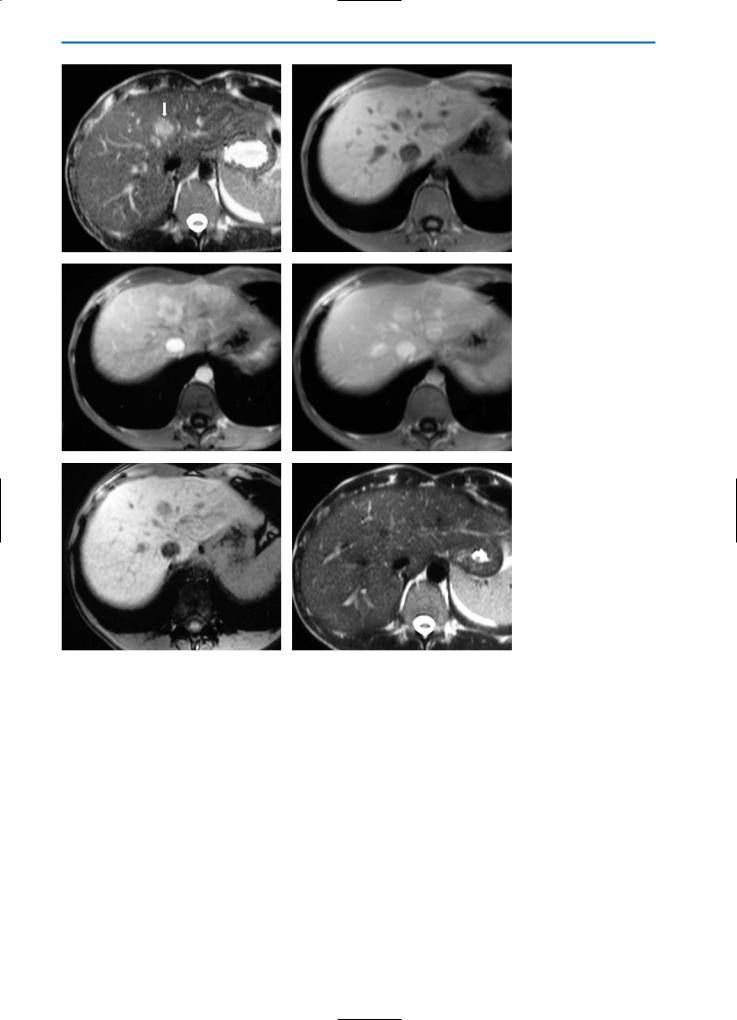
Fig. 8a-f. Focal fatty liver. On the pre-contrast T2-weighted image (a) the liver appears homogeneously, slightly hyperintense, whereas on the pre-contrast GRE T1-weighted “in-phase” image (b) it appears heteogeneous, and ill-defined slightly hyperintense areas (arrows) can be seen. The corresponding pre-contrast GRE T1-weighted “out-of-phase” image (c) shows diffuse hypointense areas (arrowheads) in both liver lobes indicating focal fatty infiltration. During the T1-weighted dynamic study after contrast agent administration, weak and heterogeneous intralesional enhancement can be detected in the arterial phase (d). Note that some vascular structures are clearly visible in the affected areas. In the portal venous phase (e), areas of focal fatty infiltration (arrows) appear as slightly hypointense compared to surrounding normal liver tissue. In the hepatobiliary phase after Gd-BOPTA administration (f) the liver is relatively homogeneous in appearance, although some of the areas of focal fatty infiltration show slightly decreased signal intensity. The signal intensity of these areas is relatively unchanged compared with the unenhanced images; however, these areas appear slightly hypointense because of the increased signal intensity of the surrounding normal liver tissue
5 • Hepatic Pseudolesions |
159 |
a |
b |
c |
d |
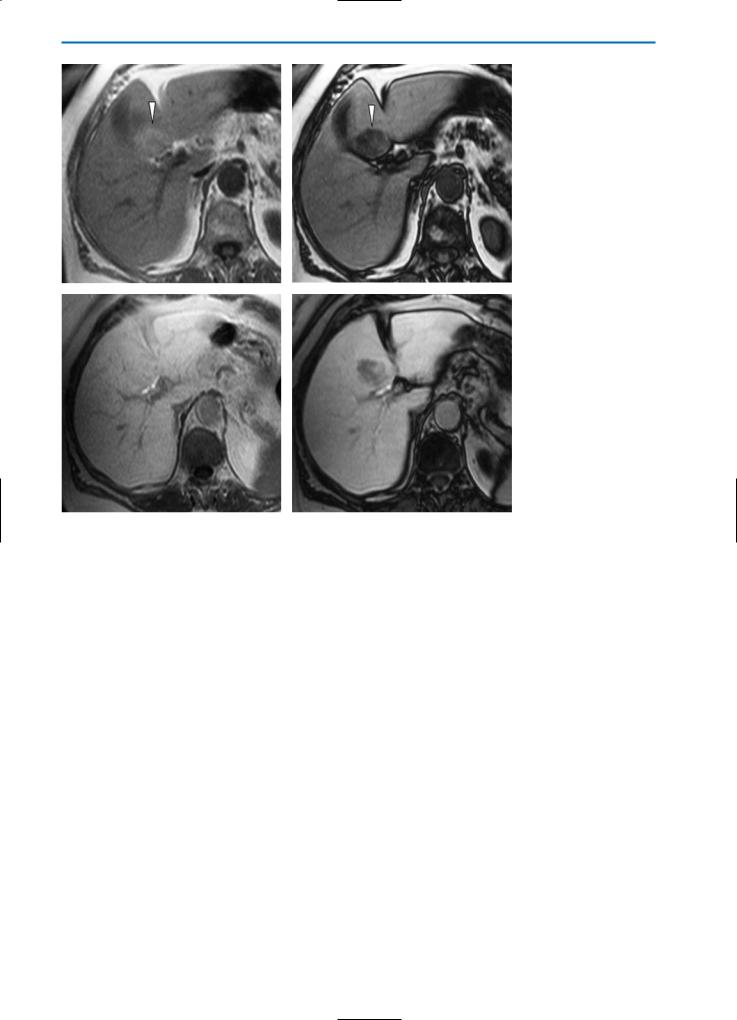
Fig. 9a-d. Focal fatty liver. An oval shaped, well-defined, slightly hyperintense area (arrowheads) in the posterior portion of segment IV can be detected on the pre-contrast GRE T1-weighted “in-phase” image (a). The lesion is heterogeneously hypointense on the pre-contrast GRE T1-weighted “out-of-phase” image (b). In the hepatobiliary phase after Gd-BOPTA administration (c, d) the area of focal fatty infiltration appears isointense on the T1-weighted “in-phase” image (c) and hypointense on the T1-weighted “out-of-phase” image (d). The decreased uptake of Gd-BOPTA is due to the altered metabolic function in the area of focal fatty infiltration
a decreased uptake of SPIO in non-diffuse areas of fat deposition [18].
While focal fat depositions may mimic the appearance of focal liver lesions, it is equally the case that focal fatty lesions such as lipoma and angiomyolipoma, but more frequently HCC or hepatic adenoma, may mimic focal fat. In order to distinguish focal fat depositions from lesions with fatty metamorphosis, the signal intensity on T2-
weighted images, the prominent vascularity, the presence of intratumoral areas of hemorrhage or necrosis, specific imaging signs such as pseudocapsule, and the enhancement behavior after administration of liver-specific contrast agents should all be taken into account (Fig. 10).

160 MRI of the Liver
a |
b |
c |
d |
e |
f |
Fig. 10a-f. HCC with fatty metamorphosis. The pre-contrast Turbo SE T2-weighted image (a) and the corresponding GRE T1-weighted “in-phase” image (b) reveal a well-defined round nodule (arrow) which is slightly hyperintense and heterogeneously isointense compared to the normal liver parenchyma, respectively. The signal intensity is reduced on the GRE T1-weighted “out-of-phase” image (c) due to the fatty content of the lesion. On dynamic T1-weighted imaging after Gd-BOPTA administration (d, e) the lesion shows strong enhancement in the arterial phase (d) and a thin, hypointense pseudocapsule (arrowhead) in the portal venous phase (e). On the delayed hepatobiliary phase image (f) the nodule is slightly hypointense, suggesting that the lesion is malignant in nature. In this case, however, the neoplastic cells in the well-differentiated HCC still have some capability to take up Gd-BOPTA and to produce bile

5 • Hepatic Pseudolesions |
161 |
5.2.2
Focal Spared Areas in Fatty Liver
Focal sparing of fatty infiltration most frequently occurs around the gallbladder and in the dorsomedial portion of the medial segment where supply to the hepatic parenchyma may derive from systemic veins such as the cystic vein of the gallbladder or an aberrant right gastric vein, rather than from the portal vein. Focal sparing can also occur adjacent to a tumor due to the presence of an arterioportal shunt or as a rim around an expansively growing tumor.
Unlike focal fat deposits, focal spared areas have a hypoechoic appearance on US. However, neither focal fat deposits, nor focal spared areas determine a mass effect with respect to vessels (Fig. 11).
On multiphasic CT, focal sparing has a hyperdense appearance that is variable with the amount of fatty liver infiltration. As in the case of focal fat infiltration, round areas of focal sparing may mimic hepatic tumors (Fig. 12).
On hepatobiliary phase T1-weighted MR images after the administration of Gd-BOPTA, focal sparing in fatty liver has an isointense or slightly hyperintense appearance (Fig. 13). A similar appearance is seen after the administration of other hepatobiliary agents such as Gd-EOB-DTPA or MnDPDP. Conversely, on T1and T2-weighted images after SPIO administration, focal spared areas in fatty liver are seen as areas of relatively low signal intensity reflecting the relatively high uptake of SPIO in these areas compared with reduced uptake in fatty areas of the liver [18]. Whereas focal fatty infiltration and focal spared areas with a round, regular appearance may mimic hepatic tumors (Figs. 12, 13), irregular or diffuse areas of infiltration or sparing may obscure focal liver lesions (Fig. 14).
5.2.3
Inflammatory Pseudotumors
Hepatic inflammatory pseudotumor is an unusual and rare tumor-like condition that is increasingly recognized as an important differential diagnosis in patients presenting with liver masses. Synonyms used to define this lesion include xanthogranuloma, fibrous xantoma, plasmacellular granuloma, histiocytoma, pseudolymphoma, and plasmocytoma, all of which reflect the histologic components of the lesion. Most commonly, the condition occurs in children and in young men. Although the etiology is unknown, some authors have suggested obliterans phlebitis starting from the portal vein as a possible cause,with secondary biliary stasis and degeneration and necrosis of the biliary ducts,leading to periductal abscess or xanthogranuloma [27].
Macroscopically,the inflammatory pseudolesion
is usually yellow-grey in color and solitary,although multifocal inflammatory pseudotumor of the liver has been described. The most frequent microscopic components are plasmacellular cells, although variable amounts of histiocytes, macrophages, fibromyoblasts, and fibrous tissue are also observed. Three histologic subtypes have been identified on the basis of the prevalence of single components, thus xanthogranulomatous type lesions have a histiocytic prevalence, plasmacellular type lesions contain mainly plasma cells, and sclerotic type lesions have a predominantly fibrotic component [46].
Typically, symptoms and laboratory findings indicate an acute inflammatory process, and recurrent pyogenic cholangitis is the most frequent clinical manifestation. Large lesions may cause a sensation of right upper abdominal quadrant fullness or discomfort, with malaise, fever and weight loss. Liver function tests sometimes demonstrate the elevation of alkaline phosphatase and γ-glutamyl- transferase.
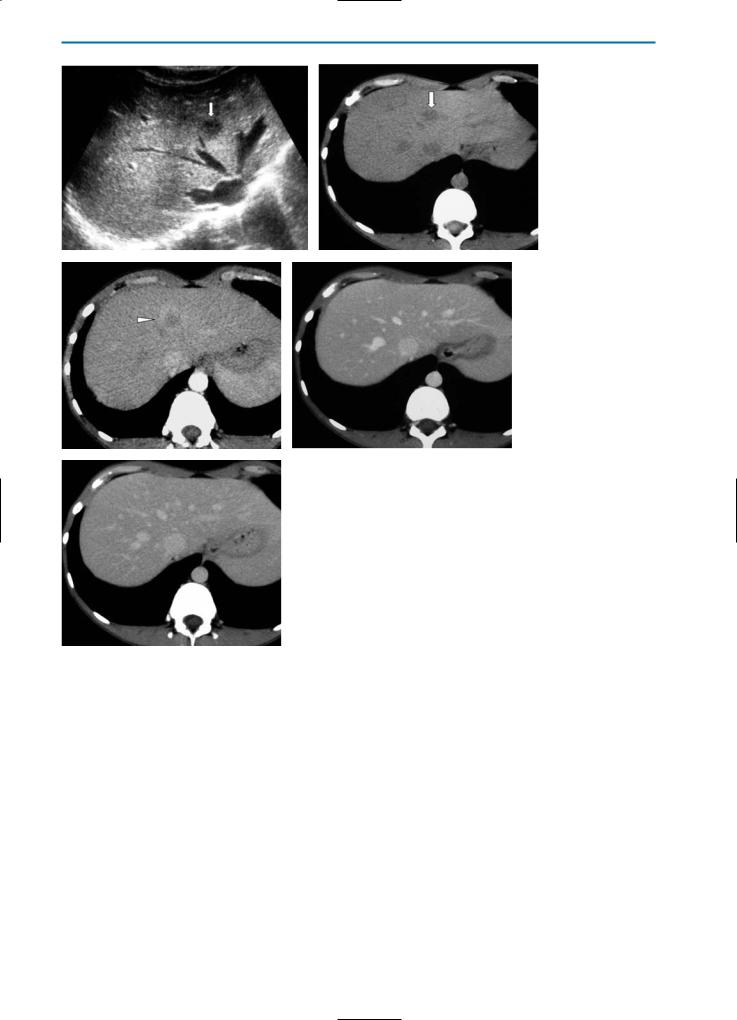
Features are non-specific on US, with lesions presenting as heterogeneously hypoechoic or mosaic patterns, similar to those observed in other focal liver neoplasms such as HCC [19]. Similarly, the appearance of an inflammatory pseudolesion is non-specific on unenhanced CT, with lesions invariably appearing hypodense. After contrast medium administration, an early intense and peripheral enhancement is usually followed by homogeneous, complete and persistent enhancement (Fig. 15). After a few minutes, peripheral enhancement and a hypodense core can be observed, the former comprising fibroblastic cells, and the latter chronic inflammatory cells [19].
On unenhanced T1-weighted MR images, inflammatory pseudotumor is typically hypointense, particularly in the central portion. Conversely, on T2-weighted images the lesion frequently demonstrates isointensity or slight hyperintensity (Fig. 16). However, the appearance is variable in relation to the histologic components: for example, slight hypointensity may be observed on T2-weighted images in lesions with a strong fibrotic predominance while a stronger hyperintense appearance is indicative of a greater predominance of inflammatory cells.
Early peripheral enhancement is typically seen on T1-weighted dynamic imaging after bolus injection of contrast agent, reflecting the cellular components and inflammatory changes within the lesion. Hepatobiliary phase imaging after administration of Gd-BOPTA or another hepatospecific contrast agent, frequently reveals a hypointense area representing the absence of hepatocytes within the lesion (Fig. 17) [19, 37].
A drop in signal on T2-weighted images after SPIO administration may reveal residual Kupffer cell function in liver parenchyma in and sur-
162 MRI of the Liver
a |
b |
Fig. 11a, b. Focal sparing on US. B-mode US (a) reveals a hypoechoic area (arrowhead) with a triangular shape near the surface of the liver. On color Doppler US (b) an intralesional vessel is clearly visible. Note the absence of any mass effect. This is typical of focal sparing in fatty liver
a |
b |
c |
d |
Fig. 12a-d. Focal sparing. Patient with Burkitt lymphoma after chemotherapy. On the US examination (a) the liver is extremely bright due to hepatic steatosis, and a round, hypoechoic nodule (arrowhead) is visible in segment IV of the liver. On the CT study (b-d) the lesion (arrowhead) does not show significant enhancement. This is indicative of focal sparing in fatty liver
5 • Hepatic Pseudolesions |
163 |
a |
b |
c |
d |
e |
f |
Fig. 13a-f. Focal sparing. Patient with history of breast cancer and chemotherapy. US evaluation (a) reveals an oval shaped, hypoechoic area (arrowhead) within a diffuse fatty liver. This is considered suspicious for metastasis. On the MR examination, this focal area (arrow) appears slightly hypointense on the pre-contrast TSE T2-weighted image (b), isointense on the GRE T1-weighted “in-phase” image (c), and hyperintense on the GRE T1-weighted “out-of-phase” image (d). On the dynamic images after Gd-BOPTA administration (e, f) the lesion does not reveal increased perfusion or wash-out. This is more indicative of an area of focal sparing in a fatty liver than of a metastasis
164 MRI of the Liver
a |
b |
c |
d |
e |
f |
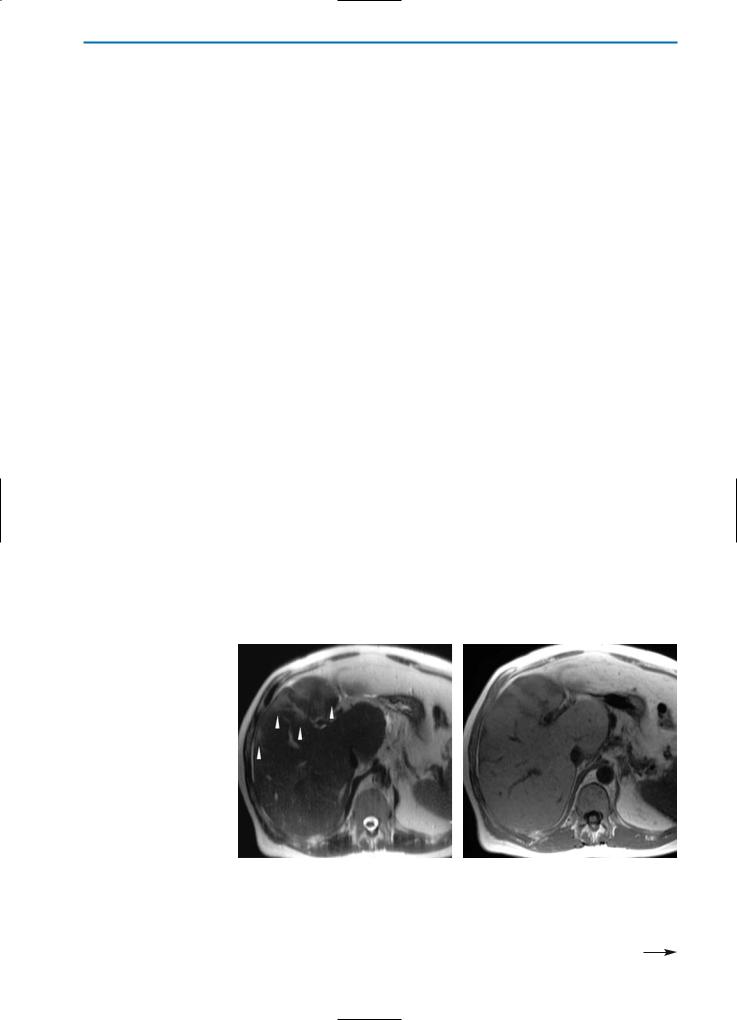
Fig. 14a-f. Focal fatty liver. Patient with history of renal cell carcinoma and chemotherapy. On the CT examination (a-c), and on theprecontrast GRE T1-weighted “in-phase” and GRE T1-weighted “out-of-phase” images (d, e), the heterogeneous, diffuse fatty infiltration does not permit the confident definition of any lesion and in particular a small and ill-defined area (arrowhead) in liver segment II. On the corresponding HASTE T2-weighted image (f) two markedly hyperintense lesions (arrows) can be seen, and the signal intensity is suggestive of hemangioma
5 • Hepatic Pseudolesions |
165 |
a |
b |
c |
d |
Fig. 15a-e. Inflammatory pseudotumor. Patient with primary immunodeficiency. On the US examination (a) a well-defined hypoechoic nodule (arrow) is detected. On the corresponding pre-contrast CT examination (b) a well-defined, oval, homogeneously hypodense lesion (arrow) is demonstrated in segment IV of the liver. After the bolus administration of contrast medium, early peripheral enhancement (arrow-
ehead) is evident in the arterial phase (c), while an isodense homogeneous appearance is seen in the portal venous (d) and equilibrium (e) phases
166 MRI of the Liver
a |
b |
c |
d |
e |
f |
Fig. 16a-g. Inflammatory pseudotumor. On the pre-contrast HASTE T2-weighted image(a)aslightlyhyperintenselesion(arrows)intheareaoftheliverhilumisvisible. On the corresponding pre-contrast T1-weighted image (b) the lesion is hypointense. Thelesionshowsheterogeneousenhancementinthearterial(c)andportalvenous(d) phases of dynamic imaging after injection of Gd-BOPTA. In the equilibrium phase (e) central wash-out of contrast agent is evident, and the lesion now demonstrates a hyperintenserim(arrowheads).Thismostlikelycorrespondstoaninflammatoryreaction and edema of the surrounding liver tissue. In the hepatobiliary phase (f) the lesion is hypointense in the center, surrounded by a slightly brighter rim. A HASTE T2-weight- ed image (g) acquired during a follow-up examination performed six months after
gantibiotic therapy reveals complete restitution and no residual tumor
5 • Hepatic Pseudolesions |
167 |
a |
b |
c |
d |
e f
Fig. 17a-f. Inflammatory pseudotumor. Same case as demonstrated in Fig.15. On the pre-contrast T2-weighted sequence (a) and on the GRE T1-weighted image (b) the lesion (arrow) appears hyperintense and heterogeneously hypointense respectively, compared to the surrounding normal liver parenchyma. Enhancement is seen in the periphery of the lesion during the arterial phase (c) after Gd-BOPTA administration. During the portal venous phase (d), the lesion appears slightly hyperintense, particularly in the central portion. During the hepatobiliary phase (e) the nodule appears hypointense, due to the absence of hepatocytes. Follow-up MR imaging after six months (f) does not reveal any focal lesions
168 MRI of the Liver
rounding the inflammatory pseudotumor. However, some authors have described lesions that show no SPIO particle uptake [37].
As it is difficult to diagnose inflammatory pseudotumor of the liver on MR imaging alone, supplemental lesion biopsy should also be performed [26].
5.2.4
Peliosis Hepatis
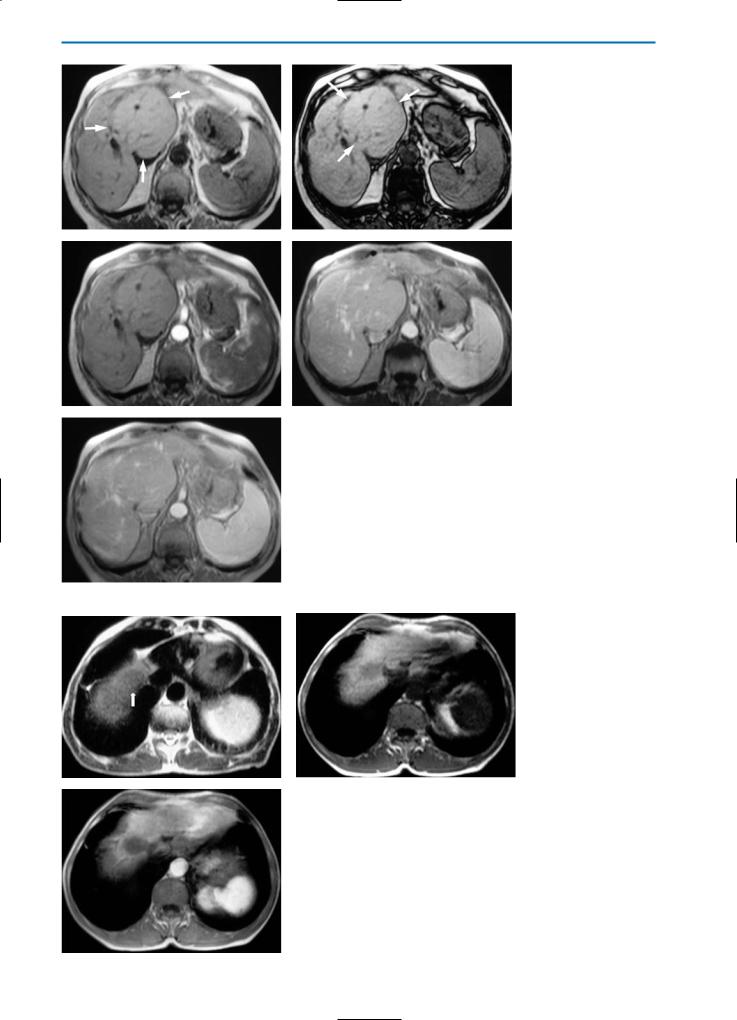
Peliosis hepatis is a rare entity characterized by blood-filled cystic cavities in the liver. Peliosis hepatis frequently develops in association with malignancies and chronic wasting diseases, such as tuberculosis. However, it has also been described in association with renal transplantation, hematological disorders and infection with human immunodeficiency virus (HIV), as well as in patients on long-term treatment with anabolic steroids, oral contraceptives, hormones, estrogen or Azathiaprine. Regression is generally observed after such agents have been stopped or after appropriate antibiotic therapy [44, 45].
Macroscopically, peliosis is characterized by cystic dilated sinusoids filled with red blood cells and bound by cords of liver cells. Two varieties have been described: the phlebectatic type, in which the blood-filled spaces are lined with endothelium and are based on aneurysmal dilatation of the central veins, and the parenchymal type, in which the blood spaces are not lined with endothelium and are usually associated with hemorrhagic parenchymal necrosis. Peliosis can be
differentiated from hemangioma by the presence of portal tracts within the fibrous stroma of the blood-filled spaces. Numerous theories have been proposed for the cause of peliosis hepatis, including outflow obstruction and hepatocellular necrosis leading to cystic blood-filled formations. Peliosis hepatis is usually found incidentally at autopsy but, rarely, it can cause hepatic failure or liver rupture with hemoperitoneum or shock. Patients sometimes have non-specific signs such as hepatomegaly and portal hypertension [44].
US findings are not specific for the diagnosis of peliosis hepatis; the hepatic echopattern is usually non-homogeneous with both hyperechoic and hypoechoic areas [30].
On CT images after the bolus administration of iodinated contrast material, these lesions usually appear initially hypodense, and become isodense over time [42].
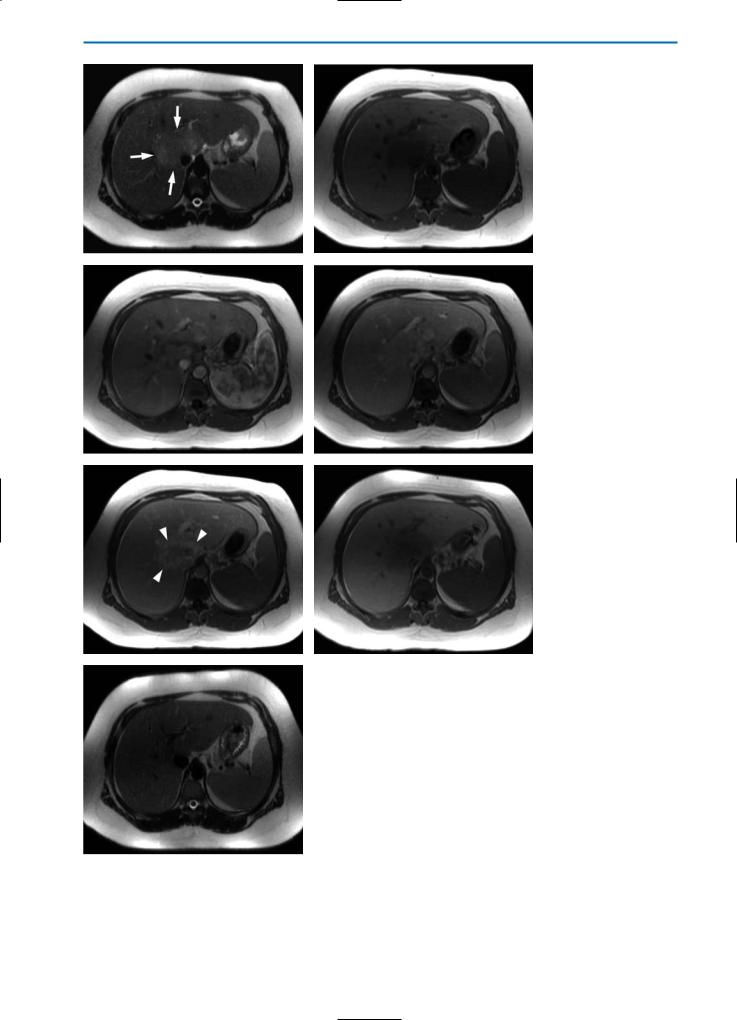
On unenhanced T2-weighted MR images, peliosis hepatis frequently demonstrates high signal intensity similar to that seen in hemangioma. Conversely, low signal intensity is usually seen on unenhanced T1-weighted images. After gadolinium administration, the lesions may show homogeneous or heterogeneous hypervascularization depending on flow, and may appear isoor hyperintense on portal venous and equilibrium phase images after Gd-BOPTA administration.
In the hepatobiliary phase after the administration of Gd-BOPTA, Mn-DPDP or Gd-EOB-DTPA, the lesion again appears hypointense because of the absence of hepatocytes within the cystic dilated sinusoids (Fig. 18).
a |
b |
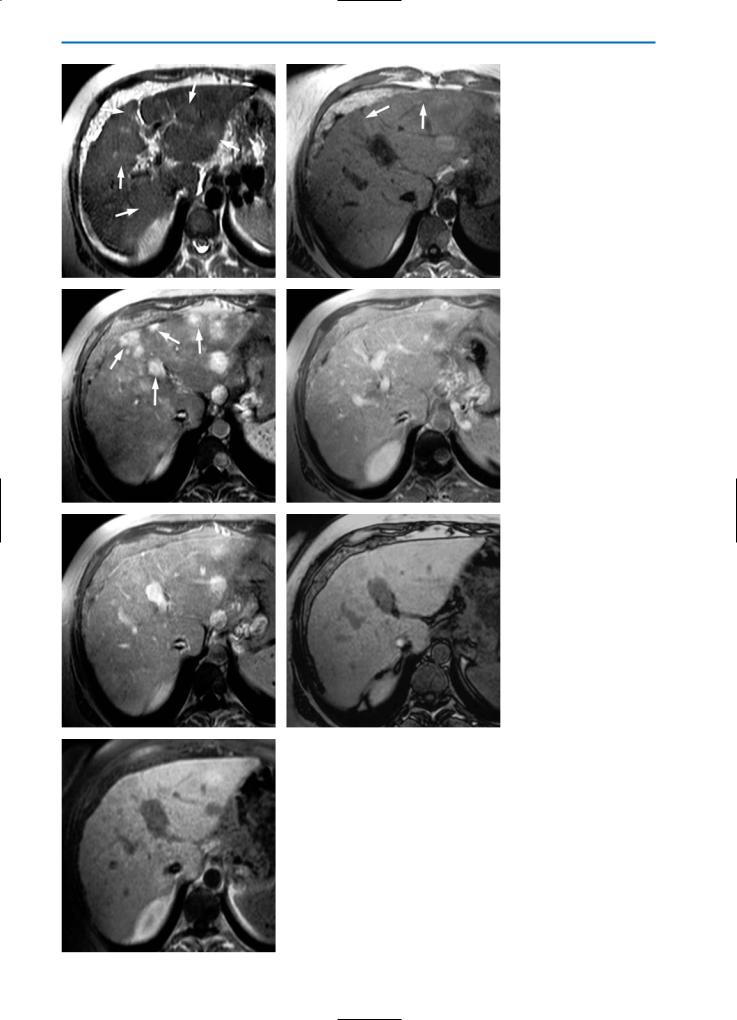
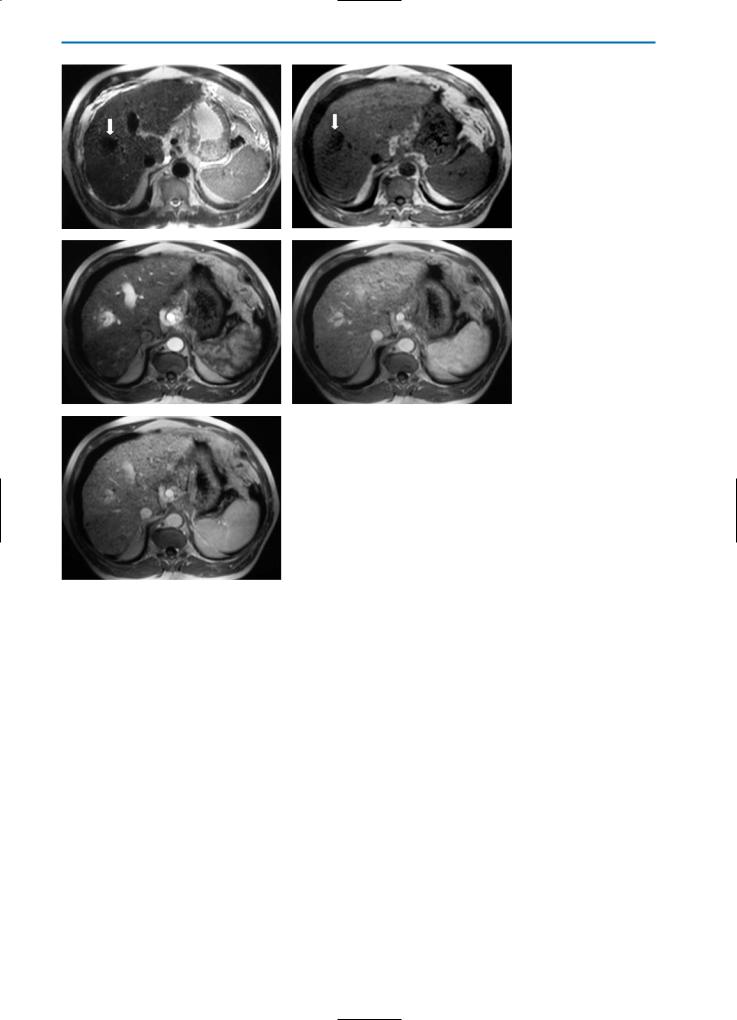
Fig. 18a-j. Peliosis hepatis. Patient with non-Hodgkin lymphoma during chemotherapy. The pre-contrast HASTE T2-weighted MR image
(a)reveals multiple ill-defined areas (arrowheads) with high signal intensity. On the corresponding unenhanced GRE T1-weighted image
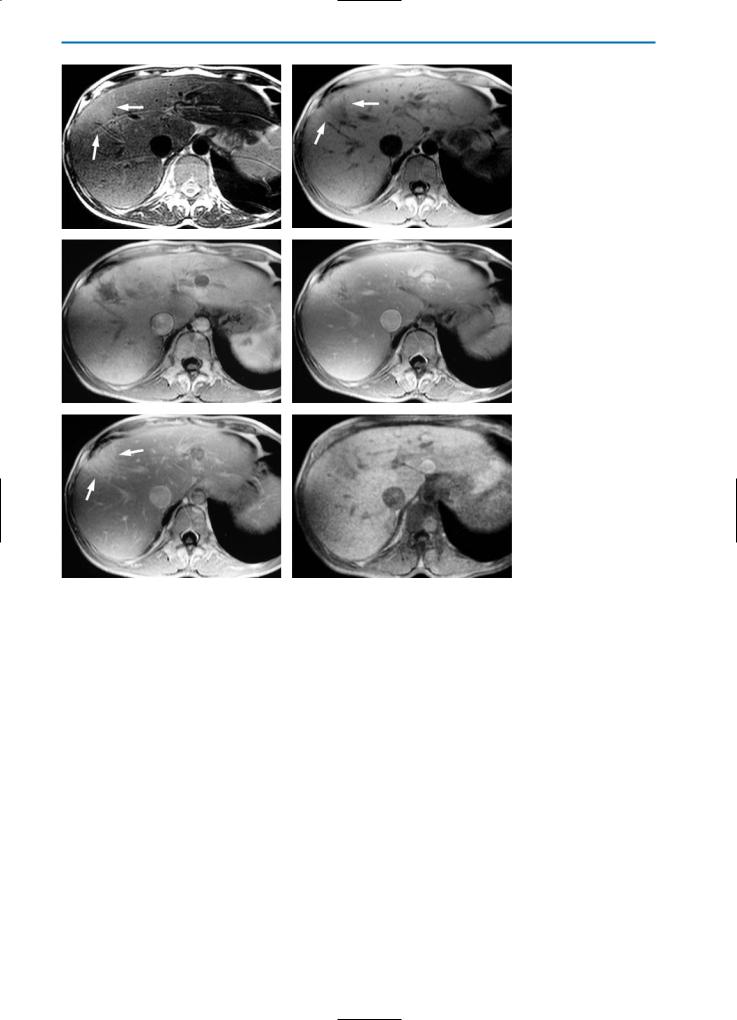
(b)these areas have low signal intensity. During the dynamic evaluation after administration of Gd-BOPTA, the lesions show homogeneous hypervascularization in the arterial phase (c) and remain hyperintense during the portal venous (d) and equilibrium (e) phases. Because of the absence of hepatocytes within the dilated sinusoids, the lesions appear hypointense on T1-weighted (f) and T1-weighted fat-sup- pressed (g) images acquired during the hepatobiliary phase after Gd-BOPTA administration. A follow-up examination performed one year
after chemotherapy (h-j) shows complete resolution of the parenchymal changes

5 • Hepatic Pseudolesions |
169 |
c |
d |
e |
f |
g |
h |
i |
j |
170 MRI of the Liver
5.2.5
Confluent Hepatic Fibrosis
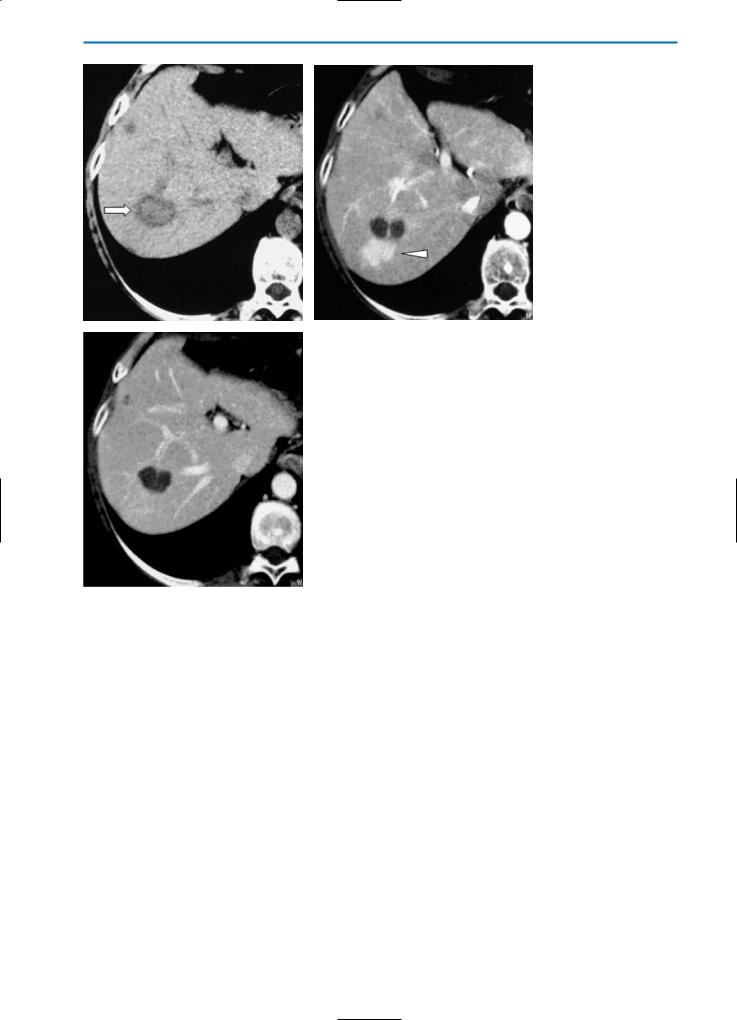
Confluent hepatic fibrosis is a mass-like fibrosis seen in approximately 15% of patients with advanced cirrhosis who are candidates for liver transplantation. The imaging findings of confluent fibrosis result in it being characterized due to its specific location in the liver, which is frequently the medial segment of the left and/or right lobe. Calcifications or dilatation of the biliary ducts are very rare.
Imaging techniques such as US are not specific for the diagnosis of confluent hepatic fibrosis; confluent fibrosis typically appears as an ill-defined hyperechoic, heterogeneous area, often with a pseudonodular aspect.
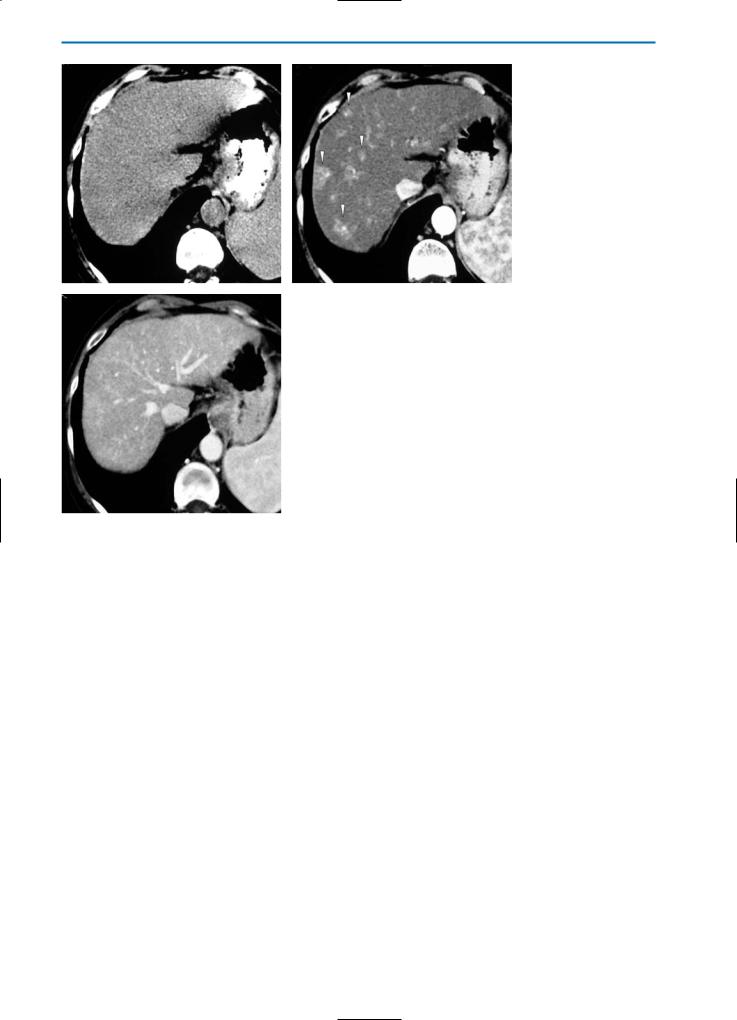
On unenhanced CT, confluent fibrosis often appears as a wedge-shaped focal area of low-density. After contrast material administration the lesion again demonstrates a low level of vascularity but may appear slightly hyperdense in the equilibrium or later phases due to the pooling effect of fibrotic tissue. Typical features such as retraction of the overlying liver capsule are evident on CT (Fig. 19).
Morphologic information on confluent fibrosis is available also after MR imaging, although the MR signal characteristics are not unique and do not permit accurate differentiation of this lesion from hepatic neoplasms. Whereas fibrotic tissue is typically hypointense with either a homogeneous or heterogeneous appearance on unenhanced T1-
and T2-weighted images, confluent hepatic fibrosis appears as a region of lower signal intensity compared to that of the adjacent liver parenchyma on T1-weighted images, and as a region of higher signal intensity on T2-weighted and STIR images. The hyperintense appearance of confluent hepatic fibrosis on T2-weighted images reflects edema within the fibrotic area [40, 41].
The appearance of confluent fibrosis on dynamic phase images after the bolus injection of a gadolinium contrast agent is similar to that observed on CT, with hyperintensity typically seen during the equilibrium phase. During the hepatobiliary phase after the administration of a hepatospecific contrast agent, confluent fibrosis typically has a heterogeneously hypointense appearance due to the reduced number of hepatocytes (Fig. 20).
Confluent fibrosis on SPIO-enhanced T2weighted images characteristically presents as a wedge-shaped area of high signal intensity with internal areas of low signal intensity. While the area of high signal intensity corresponds to the distribution of fibrosis, the low signal intensity regions reflect residual functioning liver parenchyma that is able to take up SPIO particles [33].
The differential diagnosis of confluent fibrosis in cirrhotic patients includes non-neoplastic processes such as segmental fatty liver or hepatic infarction and neoplastic processes such as infiltrative sclerosing HCC.Although irregular fatty infiltration may appear with variable shape and dis-
a |
b |
c |
d |
Fig. 19a-d. Confluent hepatic fibrosis. The pre-contrast CT scan (a) reveals a hypodense area (arrows) located in segment VIII of the liver, associated with capsular retraction. After contrast medium administration, this area shows minor enhancement in the arterial phase (b), while the density increases progressively in the portal venous (c) and equilibrium (d) phases
5 • Hepatic Pseudolesions |
171 |
a |
b |
c |
d |
e |
f |
Fig. 20a-f. Confluent hepatic fibrosis. Same case shown in Fig.19. On the pre-contrast T2-weighted image (a) and on the GRE T1-weight- ed image (b) an area (arrows) located in segment VIII of the liver appears homogeneously, slightly hyperintense and heterogeneously, slightly hypointense, respectively. The enhancement behavior during the dynamic series after administration of Gd-BOPTA is similar to that seen on CT imaging: the area does not show significant enhancement on arterial phase images (c) but shows a progressive increase in signal intensity during the portal venous (d) and equilibrium (e) phases (arrows). On the hepatobiliary phase image (f) after injection of GdBOPTA this area appears slightly hypointense compared with the normal liver

172 MRI of the Liver
tribution, the absence of capsular retraction or segmental shrinkage is often sufficient to distinguish this lesion from confluent fibrosis. Similarly, hepatic infarction can appear as a well-demarcated wedge-shaped area, but these areas typically show little or no enhancement. Moreover, hepatic infarction is rare in cirrhotic patients, occurring more frequently in patients with hematologic disorders after vascular surgery or transplantation. In the case of infiltrative sclerosing HCC, this lesion can be seen as a nearly wedge-shaped or peripheral band-like lesion, although it is usually hypervascular during the arterial phase of the dynamic study, showing wash-out in the portal venous phase. Moreover, HCC is frequently associated with a pseudocapsule and often contains areas of necrosis, hemorrhage or fatty metamorphosis within the lesion [40, 41].
5.2.6
Segmental Hypertrophy
In conditions such as cirrhosis, Budd-Chiari syndrome or primary sclerosing cholangitis the liver may be dysmorphic in appearance. In the chronic phase of Budd-Chiari syndrome, the abnormal vascularization tends to be located more peripherally and to be most prominent around the caudate lobe due to its separate autonomous venous drainage. Consequently, this liver portion may increase in volume.
In sclerosing cholangitis, atrophy and compensatory hypertrophy of the liver parenchyma are consequences of chronic obstruction of the segmental bile duct. This leads to atrophy of the affected segments and compensatory hypertrophy in other segments in which bile flow is maintained (Fig. 21). On CT and MR imaging the resulting liver hypertrophy appears more hyperdense and hyperintense on T1-weighted images respectively, compared to that of the surrounding parenchyma
Fig. 21. Segmental hypertrophy. Patient with primary sclerosing cholangitis. Color Doppler US reveals prominent vascular structures located around segment I of the liver. This segment demonstrates a progressive increase in size due to atrophy of other segments affected by sclerosing cholangitis
(Figs. 22, 23). In some cases the segmental hypertrophy has a pseudotumoral aspect.
5.2.7
Parenchymal Compression
Diaphragmatic compression of liver parenchyma due to contraction of diaphragmatic muscle bundles may create hypodense pseudonodular areas especially in segments VII and VIII of the liver. This is a typical occurrence at the time of the CT or MR examination when patients inspire deeply causing a focal increase in tissue pressure in the sub-capsular region. The result is a decrease in portal perfusion while the hepatic arterial perfusion remains relatively unchanged (Fig. 24).
Pseudolesions due to rib compression are observed in approximately 15% of patients, and are most commonly seen in the sub-capsular region of liver segments V and VI [47].
a |
b |
Fig. 22a, b. Segmental hypertrophy. Same case as demonstrated in Fig. 21. On the CT examination the liver is dysmorphic in appearance, with pseudotumoral hypertrophy of segment I (asterisk). This segment appears hyperdense on the pre-contrast image (a) as compared with the surrounding liver parenchyma that is affected by the sclerosing cholangitis. Note the dilatation of-bile ducts as typically seen in primary sclerosing cholangitis (arrows). On the post-contrast image (b) the hypertrophy shows normal perfusion and is seen with comparable density to the surrounding liver tissue
5 • Hepatic Pseudolesions 173
a |
b |
c |
d |
Fig. 23a-e. Segmental hypertrophy. On the GRE T1-weighted “in-phase” (a) and “out-of-phase” (b) images the liver hypertrophy (arrows) appears slightly hyperintense. The dynamic study after contrast agent administration (c-e) shows normal
evascularization compared to the surrounding liver
a |
b |
Fig. 24a-c. Parenchymal compression. On the pre-contrast T2-weighted (a) and GRE T1-weighted (b) images, a round, slightly hypointense lesion (arrow) can be
cseen. In the arterial phase after contrast agent administration (c) the area appears hypointense due to changes in hepatic arterial perfusion
174 MRI of the Liver
5.3
Vascular Pseudolesions
5.3.1
Transient Hepatic Attenuation Differences (THAD)
THAD is associated with numerous intrahepatic vascular conditions, particularly intrahepatic shunts.
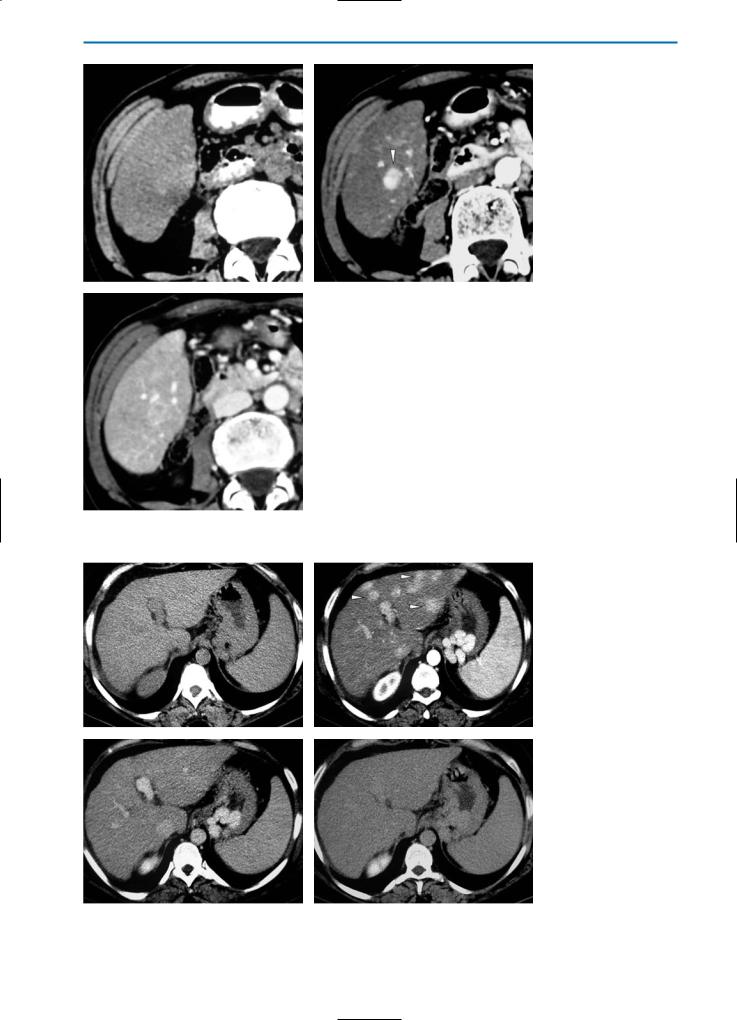
Intrahepatic shunts can be divided into arterioportal, arteriosystemic, and portosystemic, depending on the vascular connection. APS are the most common form of intrahepatic shunts, and are commonly associated with HCC or with iatrogenic causes, such as liver biopsy (Fig. 25) or radio-fre- quency (RF) ablation (Fig. 26). In APS a direct communication between the feeding arterial vessels of the neoplasm and the draining portal venules leads to increased arterial flow around the tumor [29].
Early enhancement of portal vein branches during the arterial phases of CT and MR dynamic studies is often indicative of APS. APS can sometimes be seen in association with small hemangiomas and seems to be related to the hyperdynamic vasculature of this tumor. APS are common in liver cirrhosis, due to the damaged hepatic flow (Figs. 27, 28), and can be a source of potential confusion with HCC, especially when they appear as small, round areas during the arterial phase (Figs.
29, 30).
Non-tumoral round APS show signal loss after SPIO administration, comparable to that occurring in the normal liver parenchyma. Homogeneous uptake of hepatospecific contrast agents such as Gd-BOPTA is generally observed, resulting in an isointense appearance relative to the normal parenchyma (Fig. 30 f, g) [48]. Well-differentiated small HCC may demonstrate the same enhancement behavior and the same uptake after SPIO and hepatospecific contrast agents. As a result, differential diagnosis may be difficult and biopsy or strict follow-up should be performed.
Direct communication between the portal vein and systemic veins results in intrahepatic portosystemic venous shunts. These are frequent in the setting of liver cirrhosis with portal hypertension, and may be accompanied by extrahepatic portosystemic collateral circulation.
THAD can be classified according to morphology (sectoral, segmental, and lobar), etiology (as a result of benign or malignant tumors, arterioportal shunting, liver cirrhosis, or venous thrombosis), or pathogenesis (due to low portal inflow, phlogosis, or sump effect). In the absence of a direct relationship to neoplasm, the most common cause of THAD is thrombosis of the portal vessels. The
most frequent etiopathogenesis is therefore low portal inflow due to obstruction or compression of the portal vein [21]. Low portal inflow could be a result of APS. In this case, diversion of the portal flow by arterial flow under higher pressure results in relatively low portal flow and induces compensatory collateral arterial flow which intensifies and perpetuates the phenomenon. Thus, when THAD is related to APS there is no portal block, but rather a mixing of arterial and venous blood. This pathogenesis is frequently seen in hemangioma and HCC [9], as well as in arterial phenomena not associated with focal liver lesions.
Sectoral THAD are usually triangular in shape. If the lesion is present in the medial portion, low flow is induced by compression and the THAD is fan-shaped. However, if the lesion is central the low flow is usually related to thrombosis or APS and the THAD is wedge-shaped [21] (Fig. 31). On the other hand, it is well known that APS arising in the context of cirrhosis may produce THAD that sometimes display a round or pseudo-round morphology (the axial section of the conical shape may appear round or oval). Thus, THAD is poorly distinguishable from small HCC in cirrhotic patients, or from hypervascular metastases in noncirrhotic patients [11]. Occasionally, THAD may occur as a prelude to an otherwise occult focal lesion [12] and can sometimes mask the underlying lesion.
5.3.2
Vascular Malformations
According to the Mullicken and Glowacki Classification, vascular malformations can be subdivided into: a) fast-flow forms, that comprise arteriovenous malformations and arterioportal fistulas, b) slow-flow forms, that comprise portosystemic shunts and venous as well as lymphatic malformations, and c) combined forms [38]. The vast majority of vascular pseudolesions are due to fast-flow form malformations.
5.3.2.1
Arteriovenous Malformations (AVMs)
AVMs are congenital abnormalities in the formation of blood vessels that shunt blood through direct arteriovenous connections, without neoplastic tissue between these anomalous vessels. Clinically, these congenital abnormalities can be observed in neonates with congestive heart failure, hepatomegaly, portal hypertension, and anemia, or in late childhood and in adults in the clinical setting of hereditary haemorrhagic teleangiectasia associated with congestive heart failure, hepatic is-

5 • Hepatic Pseudolesions 175
a |
b |
c |
d |
Fig. 25a-d. Arterioportal shunts. HCC after liver biopsy. On the pre-contrast CT scan (a) a hypodense, round, well-defined nodule (arrowhead) can be seen. In the arterial phase after contrast medium administration, a markedly hyperdense, triangular area (arrow) is visible near the nodule (b). In the portal venous phase (c) the area again appears isodense due to wash-out of contrast medium from this area and enhancement of the surrounding liver. Catheter angiography (d) confirms the presence of APS (arrow)
176 MRI of the Liver
a |
b |
|
Fig. 26a-c. Arterioportal shunts. HCC following treatment by RF ablation. On the |
|
pre-contrast CT scan (a) a well-defined, slightly hypodense nodule (arrow) surround- |
|
ed by a hypodense rim is demonstrated in segment VII of the right liver lobe. During |
|
the arterial phase (b) after contrast medium administration a markedly hyperdense |
c |
area (arrowhead) is seen near the necrotic lesion. This area becomes isodense in the |
portal venous phase (c) and represents an APS post RF ablation |
5 • Hepatic Pseudolesions 177
a |
b |
Fig. 27a-c. Arterioportal shunts. Patient with liver cirrhosis. On the pre-contrast CT scan (a) no focal lesions are visible. During the arterial phase (b) after contrast medium administration numerous, hyperdense areas (arrowheads) of variable size are appreciable. In the portal venous phase (c) these areas demonstrate rapid contrast
cmedium wash-out resulting in isodensity. Unlike HCC, these lesions are not hypodense and there is no indication of a pseudocapsule on the portal venous phase scan
178 MRI of the Liver
a |
b |
Fig. 28a-c. Arterioportal shunts. Patient with liver cirrhosis. On the pre-contrast CT scan (a) the liver is homogeneous in density. On the dynamic study, a round, markedly hyperdense lesion (arrowhead) can be detected in the arterial phase (b).
cRapid contrast medium wash-out occurs in the portal venous phase (c) but the lesion still appears slightly hyperdense compared to the surrounding liver parenchyma
a |
b |
c |
d |
Fig. 29a-d. Arterioportal shunts. On the pre-contrast CT scan (a) no focal lesions are visible. On the arterial phase image (b) after contrast medium administration, several hyperdense lesions (arrowheads) with different shapes are visible in the left lobe of the liver. These areas appear isodense in the portal venous (c) and equilibrium (d) phases
5 • Hepatic Pseudolesions 179
a |
b |
c |
d |
e |
f |
Fig. 30a-g. Arterioportal shunts. Same case as demonstrated in Fig. 29. On pre-con- trast T2-weighted (a) and GRE T1-weighted (b) images, diffuse ill-defined areas of signal heterogeneity (arrows) can be seen. On the arterial phase image (c) after injection of Gd-BOPTA, the lesions (arrows) located in the left lobe appear markedly hyperintense. Rapid wash-out of contrast agent occurs from these lesions during the portal venous (d) and equilibrium (e) phases. The liver shows homogeneous signal intensity on T1-weighted (f) and T1-weighted fat-suppressed (g) images acquired during the he-
gpatobiliary phase. This appearance makes the diagnosis of focal liver lesions unlikely and favours the diagnosis of APS

180 MRI of the Liver
a |
b |
c |
d |
Fig. 31a-d. THAD, focal sparing and HCC. On the pre-contrast GRE T1-weighted “out-of-phase” image (a) a triangular area of focal sparing (arrows) is clearly demarcated in an otherwise diffuse steatosis of the liver. Within the focal sparing a round hypointense lesion (arrowhead) representing an HCC can be detected. On the arterial phase image (b) after contrast agent administration a THAD reproduces the triangular focal spared area. In the portal venous phase (c) the signal intensity in the focal spared area is similar to that observed in the precontrast phase, and the round lesion is not clearly visible. On the corresponding SE T2-weighted image (d) the focal spared area is not delineated, but a round hyperintense lesion (arrow) corresponding to the HCC is recognizable
a |
b |
Fig. 32a, b. Arteriovenous malformations. On the arterial phase CT image (a), multiple, irregular and tortuous arterial vessels (arrowheads) are visible near the dome of the liver. The left portal branch (asterisk) is malformed, increased in size and shows early opacification. The portal vein is better delineated in the early portal venous phase (b) and further malformed venous vascular structures (arrowheads) are apparent surrounding the left portal branch

5 • Hepatic Pseudolesions 181
chemia, and portal hypertension [4, 7]. Frequently, AVMs may occur between the hepatic artery and the hepatic vein, as well as between the hepatic artery and the portal venous system.
On US, AVMs can appear as a nest of tortuous, enlarged, anechoic vessels located usually in one lobe of the liver. Color Doppler US generally demonstrates significant flow with high peak shifts both in arteries and veins, a low arterial resistive index (RI), and increased pulsatility of veins. In late stages of the disease, an arterialized spectral pattern can be seen in the hepatic veins [5].
On unenhanced CT, AVMs generally appear as hypoattenuating areas within the liver. In the arterial and early portal venous phases after contrast media administration these lesions enhance intensely and homogeneously. Thereafter, contrast medium equilibration results in a similar contrast density to that observed in the surrounding vascular structures (Fig. 32).
Typical findings on dynamic MR images of the liver for singular AVMs post-biopsy or surgery include a dilatation of the draining hepatic vein and an early enhancement of the hepatic veins during the arterial phase. Shunts between the hepatic artery and the portal venous system typically lead to increased portal venous pressure and thus to the usual findings of portal hypertension.
MR imaging is a very useful tool for distinguishing AVMs from hemangiomas. Specifically, signal hypointensity on T2-weighted images and the absence of progressive enhancement during the dynamic series of acquisitions after contrast agent administration make the diagnosis of AVM most probable (Fig. 33) [5, 8]. On MR angiography, AVMs are found with poor regional demarcation of the lesion, arteriovenous shunting, variable pooling of contrast material in vascular spaces, and no parenchymal blush.
5.3.2.2
Arterioportal Fistulas
Arterioportal fistulas may be acquired or congenital, and may have an intraor extrahepatic location. Common causes of acquired arterioportal fistulas are cirrhosis and hepatic neoplasms, blunt or penetrating trauma, percutaneous liver biopsy, gastrectomy, transhepatic cholangiography, and biliary surgery (Fig. 34). In the case of congenital arterioportal fistulas, these are typically associated with hereditary hemorrhagic teleangectasia, biliary atresia, and Ehlers-Danlos Syndrome. Often asymptomatic within the first year of life, the first symptom of arterioportal fistula is usually portal hypertension associated with splenomegaly, hypersplenism, variceal formation, and ascites [2].
US with color Doppler is the most useful imaging technique for making the diagnosis of arterioportal fistula. At Doppler US, common features include enlargement of the hepatic artery and dilatation of the segment of the portal vein in which the fistula is located. In congenital arterioportal fistula, hepatofugal flow in the portal vein can be detected along with color speckling in the hepatic parenchyma adjacent to the fistula, which is due to vibration artifact [14].
Imaging features of arterioportal fistulas on dynamic CT and MR include marked enhancement of the main portal vein, segmental branches, or major tributaries, with attenuation or signal intensity approaching that of the aorta during the arterial phase. Perfusion anomalies of the surrounding liver parenchyma such as regional increases in arterial inflow as a response to inverted portal flow, and increased portal vein inflow due to the shunt itself, may also be observed [16].Angiography is often indicated for possible embolization.
5.3.2.3
Hereditary Haemorrhagic Telangiectasia (HHT)
HHT, also called Rendu-Osler-Weber disease or Osler’s disease, is a vascular, hereditary, autosomic dominant disorder that occurs with a frequency of approximately 10-20 cases/100,000 [15]. HHT is characterized by the presence of mucocutaneous or visceral angiodysplastic lesions, the latter most frequently seen in the liver, lung, brain, and gastrointestinal tract. Hepatic involvement accounts for 10-40% of cases and is characterized by the presence of intrahepatic shunts (arterioportal, arteriosystemic, venous portosystemic), diffuse telangiectases, and vascular mass-forming lesions [3]. AVMs are usually distributed diffusely throughout the liver and may be associated with enlargement of the hepatic artery and increased tortuousity of vessels in the liver hilum and in the central portions of the liver lobes. In Osler’s disease, increased arterial perfusion of the liver tissue frequently leads to secondary nodular hypertrophy, which may be misinterpreted as a malignant hepatic tumor. These pseudotumors, as in focal nodular hyperplasia, represent a localized overgrowth of hepatocellular tissue and are not real liver tumors. Patients with hepatic involvement can be asymptomatic, but heart failure, portosystemic encephalopathy, cholangitis, portal hypertension, and cirrhosis have been reported [34].
Focal or diffuse changes in hepatic circulation are detectable on all of the imaging modalities. US, particularly in association with color Doppler, shows intrahepatic shunts with arterial and venous vessels frequently increased in size. However, this imaging method has comparatively low sensitivity

182 MRI of the Liver
a |
b |
c |
d |
e |
f |
Fig. 33a-f. Arteriovenous malformations in a healthy young patient. An US scan (a) shows an abnormal communication (arrow) between an arterial branch and a venous vessel. On pre-contrast T1and T2-weighted MR images (b, c) a small, hypointense area (arrowheads) is visible in the lower parts of segment VII of the liver. On the arterial phase image (d) the lesion (arrowhead) shows intense and homogeneous enhancement. Early enhancement of a right portal vein branch (arrow) is also evident. The lesion shows the same signal intensity as observed in surrounding vascular structures in the portal venous (e) and equilibrium (f) phases
5 • Hepatic Pseudolesions 183
a |
b |
c |
d |
Fig. 34a-e. Arterioportal fistula in a cirrhotic patient. On the T2-weighted (a) and T1-weighted (b) MR images, the fistula (arrows) appears as a hypointense, round area, with a signal void close to that observed in the aorta and portal vein. In all phases of the dynamic evaluation after contrast agent administration (c-e) the enhance-
ement of the vascular area is similar to that occurring in the aorta and the left branch of the portal vein that indicates an arterioportal fistula
and spatial resolution for demonstrating small arteriovenous shunts [39].
On multidetector CT, the possibility to perform a selective, multiphase study of hepatic vascular structures permits both arterial and venous vessels to be visualized. Hence, the visualization of arteriosystemic shunts is improved. Compared with conventional spiral CT, multidetector CT improves image quality, and permits better multiplanar and angiographic reconstruction. Consequently, the capability to identify and characterize the vascular lesions typical of HHT is improved [8]. Thus telangiectases, which are present in more than 60% of cases of HHT, are seen as small vascular spots that are readily recognizable on reconstructed multiplanar reformatted and maximum intensity projection (MIP) images. Likewise, large confluent vascular masses, which are present in about 25% of HHT cases, are seen as large shunts or multiple telangiectases that coalesce. In a recent study, multidetector CT (MDCT) was able to detect hepatic vascular alterations in about 80% of patients with
a confirmed or suspected diagnosis of HHT [35]. In this study arterioportal shunts and arteriosystemic shunts were detected as the only vascular alterations in roughly 50% and 20% of patients, respectively, while both shunt types were detected in approximately 30% of patients.
On MR imaging, telangiectases appear as small hypoto isointense lesions on unenhanced T1weighted images and as isoor hyperintense lesions on T2-weighted images (Fig. 35).Whereas arteriovenous shunts are poorly detected on unenhanced T1and T2-weighted images, dilatated and tortuous vessels can usually be seen near the arteriovenous shunts.
Dynamic MR imaging reveals strong arterial phase enhancement and subsequent isointensity with the surrounding liver tissue in the portal venous and equilibrium phases. Normal enhancement of the affected tissue in the hepatobiliary phase can be noted with the use of contrast agents with hepatocellular properties such as Gd-BOPTA (Fig. 36).
184 MRI of the Liver
a |
b |
Fig. 35a, b. Hereditary haemorrhagic teleangiectasia. The pre-contrast T2-weighted fat-suppressed TSE image (a) reveals almost complete exchange of normal hepatic structure by diffuse small, round markedly hyperintense lesions. On the GRE T1-weighted image (b) the lesions demonstrate similar hypointensity to that observed in the vessels
a |
b |
|
|
Fig. 36a-c. Hereditary haemorrhagic teleangiectasia. Diffusely distributed |
|
|
AV-malformations in a patient with Osler’s disease. On the T2-weighted image |
|
|
(a) areas of flow void (arrows) in the liver can be noted indicating increased |
|
|
flow in branches of the hepatic artery. Additionally, some nodular-appearing |
|
|
liver lesions (arrowheads) in the right liver lobe can be seen. These lesions (ar- |
|
|
row) are clearly hypervascular on the arterial phase image after injection of Gd- |
|
|
BOPTA (b). In the hepatobiliary phase one hour after injection of Gd-BOPTA (c), |
|
|
the lesions appear hyperintense compared to the surrounding liver tissue due |
|
|
to uptake of the contrast agent into hepatocyctes. These liver lesions corre- |
|
|
spond to a localized overgrowth of hepatocellular tissue similar to that which |
|
|
occurs in FNH. The lesions appear hyperintense in the hepatobiliary phase due |
|
c |
to the delayed excretion of Gd-BOPTA into the newly formed and malformed |
|
bile ductules |
||
|

5 • Hepatic Pseudolesions 185
References
1. Alpers DH, Sabesin SM, White HM. Fatty liver: biochemical and clinical aspects. In Schiff L, Schiff E (eds). Diseases of the liver, 7th edn. JB Lippincott, Philadelphia 1993
2. Altuntas B, Erden A, Karakurt C, et al. Severe portal hypertension due to congenital hepatoportal arteriovenous fistula associated with intrahepatic portal vein aneurysm. J Clin Ultrasound 1998; 26:357-360 3. Bernard G, Mion F, Henry L, et al. Hepatic involvement in hereditary hemorrhagic teleangiectasia: clinical radiological and hemodynamic studies of 11
cases. Gastroenterology 1993; 105:482-487
4. Boon LM, Burrows PE, Paltiel HJ, et al. Hepatic vascular anomalies in infancy: a twenty-seven-year experience. J Pediatr 1996; 129:346-354
5. Borner G, Peer S, Karner M, et al. Nontumorous vascular malformations in the liver: color Doppler ultrasonographic findings. J Ultrasound Med 2002;
21:187-197
6. Brawer MK, Austin GE, Lewin KJ. Focal fatty change of the liver, a hitherto poorly recognized entity. Gastroenterology 1980; 78:247-252
7. Burrows PE, Dubois J, Kassarjian A. Pediatric hepatic vascular anomalies. Pediatr Radiol 2001;
31:533-545
8. Buscarini E, Buscarini L, Civardi G, et al. Hepatic vascular malformations in hereditary hemorrhagic teleangiectasia: imaging findings. Am J Roentgenol
1994; 163:1105-1110
9. Chen JH, Chai JW, Huang CL, et al. Proximal arterioportal shunting associated with hepatocellular carcinoma: features revealed by dynamic helical CT. Am J Roentgenol 1999; 172:403-407
10. Chen WP, Chen JH, Hwang JI, et al. Spectrum of transient hepatic attenuation differences in biphasic helical CT. AJR Am J Roentgenol 1999; 172:419-424 11. Colagrande S, Carmignani L, Pagliari A, et al. Transient hepatic attenuation differences (THAD) not connected to focal lesions. Radiol Med 2002; 104:25-
43
12. Colagrande S, Centi N, Carmignani N, et al. Meaning and etiopathogenesis of sectorial transient hepatic attenuation differences (THAD). Radiol Med
2003; 105:180-187
13. Couinaud C. The parabiliary venous system. Surg Radiol Anat 1988; 10:311-316
14. D’Agostino D, Orsi M. Congenital hepatic arterioportal fistula. J Pediatr Gastroenterol Nutr 1999;
29:487
15. Dakeishi M, Shioya T, Wada Y, et al. Genetic epidemiology of hereditary hemorrhagic teleangiectasia in a local community in the northern part of Japan. Hum Mutat 2002; 19:140-148
16. Gallego C, Velasco M, Marcuello P, et al. Congenital and acquired anomalies of the portal venous system. Radiographics 2002; 22:141-159
17. Gilmore IT, Burrohghs A, Murray-Lyon IM, et al. Indications, methods and outcomes of percutaneous liver biopsy in England and Wales: An audit by the British Society of Gastroenterology and the Royal College of Physicians of London. Gut 1995;
36:437-441
18. Hirohashi S, Ueda K, Uchida H, et al. Nondiffuse fatty change of the liver: discerning pseudo-tumor
on MR images enhanced with ferumoxides. Initial observations. Radiology 2000; 217:415-420
19. Horiuchi R, Uccida T, Kojima T, et al. Inflammatory pseudotumor of the liver. Clinicopathologic study and review of the literature. Cancer 1990; 65:1583-
1590
20. Itai Y, Matsui O. Blood flow and liver Imaging. Radiology 1997; 202:306-314
21. Itai Y, Saida Y, Irie T, et al. Intrahepatic portosystemic venous shunts: spectrum of CT findings in external and internal subtypes. J Comput Assist Tomogr 2001; 25:348-354
22. Joy D, Thava VR, Scott BB. Diagnosis of fatty liver disease: is biopsy necessary? European J Gastroenterology and Hepatology 2003; 15:539-543
23. Kammen BF, Pacharn P, Thoeni RF, et al. Focal fatty infiltration of the liver: Analysis of prevalence and CT findings in children and young adults. Am J Roentgenol 2001; 177:1035-1039
24. Kawasaki T, Carmichael FJ, Saldivia V, et al. Relationship between portal venous and hepatic arterial blood flows. Spectrum of response. Am J Physiol
1990; 259:1010-1018
25. Kemper J, Jung G, Poll LW, et al. CT and MRI findings of multifocal hepatic steatosis mimicking malignancy. Abdom Imaging 2002; 27:708-710
26. Kim SR, Hayashi Y, Kudo M, et al. Inflammatory pseudotumor of the liver in a patient with chronic hepatitis C: difficulty in differentiating it from hepatocellular carcinoma. Pathol Int 1999; 49(8):726-
30
27. Krech RH, Erhaedt-Domagalski M, Neumann H. Inflammatory pseudotumor of the liver. Morphologic and cytophotometry studies and differential diagnosis. Pathologe 1995; 16(6):415-420
28. Kuwatsuru R, Brasch RC, Muhler A, et al. Definition of liver tumors in the presence of diffuse liver disease: comparison of findings at MR imaging with positive and negative contrast agents. Radiology
1997; 202:131-138
29. Lane MJ, Jeffrey B, Katz DS. Spontaneous intrahepatic vascular shunts: Am J Roentgenol 2000;
174:125-131
30. Lloyd RL, Lyons EA, Levi CS, et al. The sonographic appearance of peliosis hepatis. J Ultrasound Med
1982; 1:293-294
31. Mathieu D, Vasile N, Menu Y, et al. Budd-Chiari syndrome. Dynamic CT. Radiology 1987; 165:409-
413
32. Matsui O, Takahashi S, Kadoya M, et al Pseudolesion in segment IV of the liver at CT during arterial portography: correlation with aberrant gastric venous drainage. Radiology 1994; 193:31-35
33. Matsuo M, Kanematsu H, Kondo T, et al. Confluent hepatic fibrosis in cirrhosis: ferumoxides-enhanced MR imaging findings. Abdom Imaging 2001; 26:146-
148
34. Memeo M, Stabile Ianora AA, Scardapane A, et al. Hepatic involvement in hereditary hemorrhagic teleangiectasia: CT findings. Abdominal imaging
2004; 29:211-220
35. Memeo M, Stabile Ianora AA, Scardapane A, et al. Hereditary hemorrhagic teleangiectasia: study of hepatic vascular alterations with multi-detector row helical CT and reconstruction programs. Radiol Med 2005; 109:125-138
186 MRI of the Liver
36. Michels NA. Newer anatomy of the liver and its variants blood supply and collateral circulation. Am J Surg 1966; 112:337-347
37. Mortele KJ, Wiesner W, De Hemptinne B, et al. Multifocal inflammatory pseudotumor of the liver: dynamic gadolinium-enhanced, ferumoxide-en- hanced, and mangafodipir trisodium-enhanced MR imaging findings. Eur Radiol 2002; 12(2):304-308
38. Mullicken JB, Glowacki J. Hemangiomas and vascular malformations in infants and children: a classification based on endothelial characteristics. Plast Reconstr Surg 1982; 69:412-422
39. Naganuma H, Ishida H, Niizzawa M, et al. Hepatic involvement in Osler-Weber-Rendu Disease: findings on pulsed and color Doppler sonography. Am J Roentgenol 1995; 165:1421-1425
40. Ohtomo K, Baron RL, Dodd GD 3rd, et al. Confluent hepatic fibrosis in advanced cirrhosis: evaluation with MR imaging. Radiology 1993; 189:871-874
41. Ohtomo K, Baron RL, Dodd GD 3rd, et al. Confluent hepatic fibrosis in advanced cirrhosis: appearance at CT. Radiology 1993; 188:31-35
42. Pliskin M. Peliosis hepatis. Radiology 1975; 114:29-
30
43. Ternberg JL, Butcher HR Jr. Blood flow relation between hepatic artery and portal vein obstruction. Science 1965; 150:1030-1031
44. Vignaux O, Legmann P, De Pinieux G, et al. Hemorrhagic necrosis due to peliosis hepatis: imaging findings and pathological correlation. Eur Radiol
1999; 9:454-456
45. Yanoff M, Rawson A. Peliosis hepatis: an anatomic study with demonstration of two varieties. Arch Pathol 1964; 77:159-165
46. Yoon KH, Ha HK, Lee JS, et al. Inflammatory pseudotumor of the liver in patients with recurrent pyogenic cholangitis: CT-histopathologic correlation. Radiology 1999; 211:373-379
47. Yoshimitsu K, Honda H, Kuroiwa T, et al. Unusual hemodynamics and pseudolesions of the non cirrhotic liver at CT. Radiographics 2001; 21:81-96
48. Yu JS, Rofsky NM. Magnetic resonance imaging of arterioportal shunts in the liver. Top Magn Reson Imaging 2002; 13:165-176