


14 Part I – High-Fluid Content Liver Lesions
7 Cystadenoma / Cystadenocarcinoma
Cystic neoplasms, including biliary cystadenomas and cystadenocarcinomas, are estimated to comprise approximately 5 % of liver cysts. Cystadenomas occur predominantly in middle-aged women (41 – 53 years) and present as incidental findings at imaging. Cystadenomas are often diagnosed incorrectly as simple cysts and treated with aspiration or incomplete excision, which results in recurrence or persistent cyst. The potential for malignant transformation into a cystadenocarcinoma is documented. Biliary cystadenocarcinomas are rare and present almost invariably with symptoms at an older age (around 60 years).
Literature
1.Devaney K, Goodman ZD, Ishak KG (1994) Hepatobiliary cystadenoma and cysadenocarcinoma. A light microscopic and immunohistochemical study of 70 patients. Am J Surg Pathol 18:1078 – 1091
2.Korobkin M, Stephens DH, Lee JK, et al. (1989) Biliary cystadenoma and cystadenocarcinoma: CT and sonographic findings. AJR Am J Roengenol 153:507 – 511
3.Vogt DP, Henderson JM, Chmielewski E (2005) Cystadenoma and cystadenocarcinoma of the liver: a single center experience. J Am Coll Surg 200:727 – 733
4.Ishak KG, Willis GW, Cummins SD, et al. (1977) Biliary cystadenoma and cystadenocarcinoma. Cancer 39:322 – 338
MR Imaging
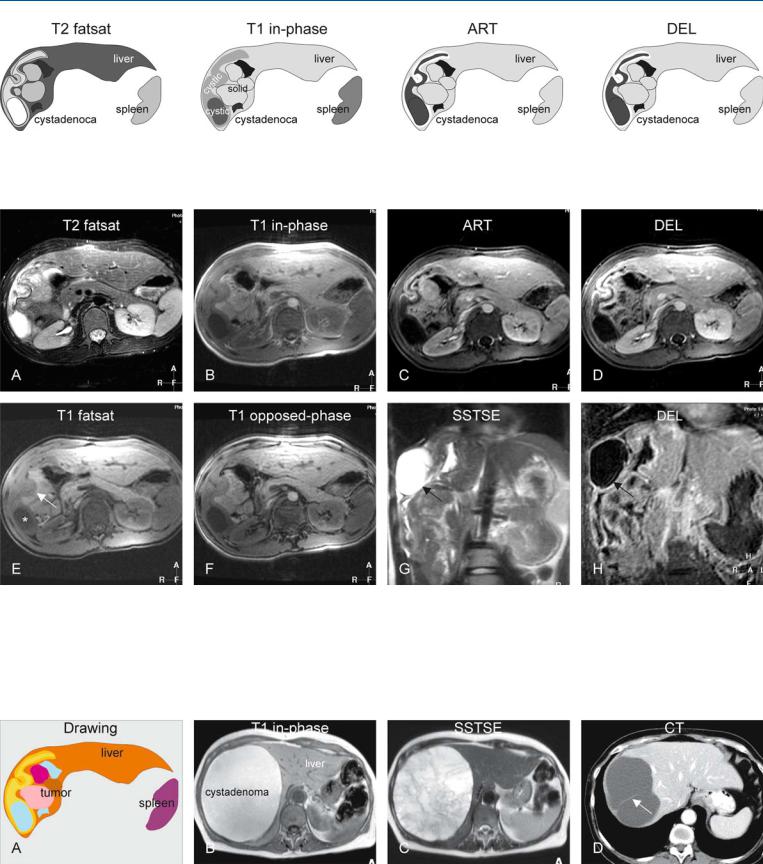
Cystadenomas appear as multilocular cystic lesions with low signal intensity on T1-weighted sequences, high signal intensity on T2-weighted sequences, and enhancement of the multiple septa in the delayed phase of the dynamic gadolinium-enhanced images. Cystadenoma cannot be distinguished with certainty from cystadenocarcinoma at imaging. Cystadenocarcinomas though tend to have thick and coarse septa with soft tissue nodules. The cystic component may show variable signal intensity on T1and T2-weighted sequences due to the variable amount of mucinous fluid. The soft tissue nodules may show variable early to late persistent enhancement (Figs. 7.1 – 7.3). At CT, the presence of thick and coarse septal calcifications may suggest malignancy.
Differential Diagnosis
Differential diagnosis of a large multiloculated cystic liver lesion may include pyogenic abscess, echinococcus cyst, and cystic metastases.
Pathology
Cystadenomas are multilocular with benign cuboidal to columnar epithelium and often contain densely cellular spindle cell („ovari- an-like“) stromata. Most lesions are lined with mucinous epithelium. Cystadenocarcinomas are also multilocular with malignancy in situ (minority) or invasive tubulopapillary or solid epithelial components; in addition, parts of preexisting cystadenoma may coexist.
Management
Cystadenomas and cystadenocarcinomas require complex excision to prevent recurrence and possible malignant transformation. Most cases will recur after aspiration only or partial resection.
7 Cystadenoma / Cystadenocarcinoma 15
Fig. 7.1. Cystadenocarcinoma, drawings. T2 fatsat: a large lesion with solid and cystic areas is present in the right liver; T1 in-phase: the cystic areas have variable signal intensity probably due to variable fluid content (more or less
Fig. 7.2. Cystadenocarcinoma, solid and cystic lesion. A Axial T2-w fat suppressed TSE image (T2 fatsat): A large tumor is visible within the right liver with cystic and solid components with respectively high and low signal intensity. B Axial in-phase T1-w GRE (T1 in-phase): Tumor shows cystic areas with variable signal intensity. C Axial arterial phase post-Gd 2D T1-w GRE image (ART): The solid areas show intense enhancement. D Axial delayed phase post-Gd 2D T1-w GRE image (DEL): The solid areas remain en-
protein content); ART: most of the solid component and the thick irregular wall of the cystic component show early enhancement; DEL: the enhanced areas retain their contrast
hanced. E Axial fat-suppressed T1-w GRE image (T1 fatsat): Tumor shows cystic areas with low (*) and intermediate (arrow) signal intensity. F Axial opposed-phase GRE image (T1 opposed-phase): Tumor shows no evidence of fat. G Coronal SSTSE image (SSTSE): the cystic areas are very bright (arrow) and solid parts are isointense with the liver. H Coronal delayed phase GRE image (DEL): The cystic components (arrow) are surrounded by thick irregular walls
Fig. 7.3. Cystadenocarcinoma (drawing of patient above), and cystadenomas (two different patients). A Drawing illustrates the complexity of the tumor with cystic and solid components. B T1-weighted image shows a large lesion with high signal due to mucinous contents. C T2-weighted image
shows multilocular lesion with slightly variable high signal. No enhancing solid components were present (not shown). D CT from another patient shows a thick septum (arrow) within a cystic lesion

16 Part I – High-Fluid Content Liver Lesions
8 Hemangioma I – Typical Small
Hemangiomas are the most common benign hepatic lesions, with an incidence between 0.4 % and 20 % in normal subjects, and with a strong female preponderance. The male-to-female ratio is about 1:5. Autopsy studies suggest that many hemangiomas are small (around 5 mm); therefore, the real prevalence of liver hemangiomas probably exceeds the number found by imaging studies. At imaging, hemangiomas are often found as incidental findings or during staging of (colorectal) malignancy. Small lesions may be difficult to characterize at US and CT.
Literature
1.McFarland EG, Mayo-Smith WW, Saini S, et al. (1994) Hepatic hemangiomas and malignant tumors: improved differentiation with heavily T2-weighted conventional spin-echo MR imaging. Radiology 193:43 – 47
2.Mitchell DG, Saini S, Weinreb J, et al. (1994) Hepatic metastases and cavernous hemangiomas: Distinction with standardand triple-dose gado- teridol-enhanced MR imaging. Radiology 193:49 – 57
3.Hussain SM, Semelka RC (2005) Liver masses. Magn Reson Imaging Clin N Am 13:255 – 275
MR Imaging Findings
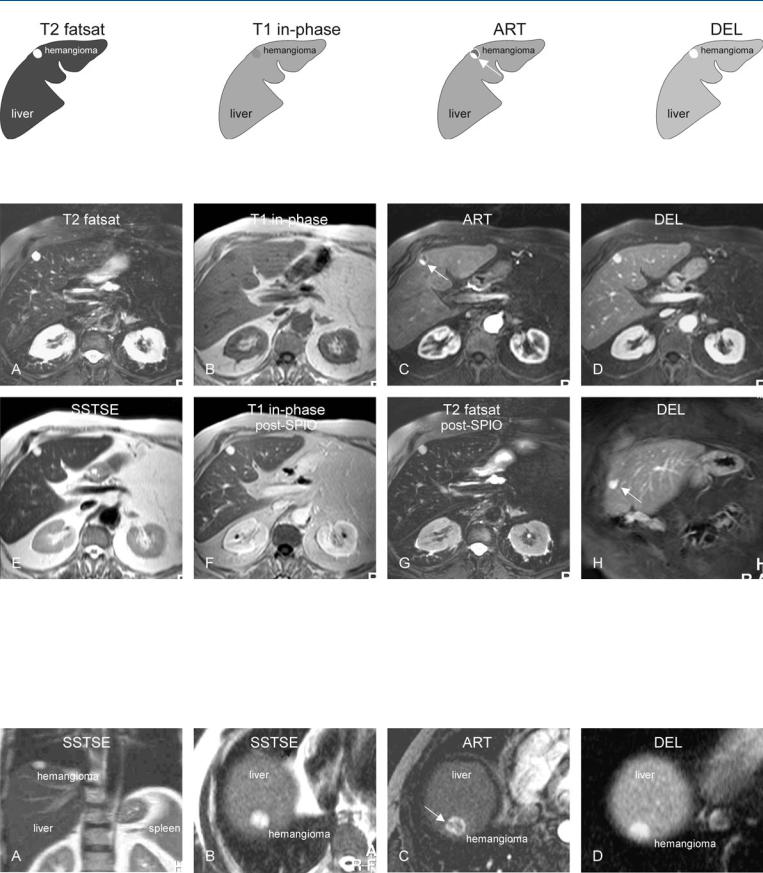
At MR imaging, small hemangiomas have a characteristic appearance. MRI is more specific than CT and shows hemangiomas as hypointense on T1and moderately hyperintense on T2-weighted images. Hemangiomas, like cysts, maintain their high signal on sequences with long TE values (> 120 ms). Most of the small hemangiomas show typical peripheral nodular (or discontinuous ringshaped) enhancement in the arterial and portal phases. The smaller the lesion the smaller the enhanced peripheral nodule will be. In the delayed phase, most hemangiomas retain contrast longer than the surrounding normal liver tissue (Figs. 8.1 – 8.3). A combination of moderately high signal on T2-weighted images and peripheral nodular enhancement is very specific, and therefore even very small lesions can be detected and characterized with certainty using state-of-the-art MR imaging. Several groups have shown that an accurate diagnosis usually can be reached with MRI in 90 – 94 % of patients. In our experience with the use of current faster sequences, accuracy is probably much higher and reaches almost 100 %. Therefore, a biopsy is not necessary in the majority of lesions.
Differential Diagnosis
For typical small hemangiomas with high signal on T2 and peripheral nodular enhancement, there is no differential diagnosis. For atypical cases (either the signal intensity or the enhancement pattern is not quite typical), chemotherapy-treated or mucinous metastases may be considered. Very small hemangiomas may show (rapid) enhancement of the entire lesion in the arterial phase and may raise a differential diagnostic issue with arterioportal shunts and early enhancing neoplasms (see also flash-filling hemangioma on p. 24).
Treatment
Typical small hemangiomas do not need any treatment or followup with imaging.
8 Hemangioma I – Typical Small 17
Fig. 8.1. Hemangioma, small, drawings. T2 fatsat: hemangioma is markedly hyperintense to the liver; T1 in-phase: hemangioma is hypointense to the
Fig. 8.2. Hemangioma, small, typical MRI findings in a patient with suspected liver metastasis. A Axial fat-suppressed T2-w TSE image (T2 fatsat): Hemangioma is hyperintense to the liver. B Axial in-phase image (T1 in-phase): Hemangioma is hypointense to the liver. C Axial arterial phase image (ART): Hemangioma shows typical peripheral nodular enhancement (arrow). D Axial delayed phase image (DEL): Hemangioma shows persistent homogeneous enhancement. E Axial SSTSE image (TE = 120 ms) (SSTSE): Hemangioma remains bright, which indicates its non-solid nature. F Axial in-
liver; ART: hemangioma typically shows a peripheral nodular enhancement (arrow); DEL: hemangioma shows complete homogeneous enhancement
phase image after gadolinium and uptake of superparamagnetic iron oxide (SPIO) (T1 in-phase post-SPIO): Gd-enhanced hemangioma appears even brighter in darker liver due to T2* effect caused by the uptake of SPIO into Kupffer cells of the liver. G Axial TSE image (T2 fatsat post-SPIO): Unlike the liver, hemangioma does not contain Kupffer cells and remains bright. H Coronal delayed phase image (DEL): Hemangioma shows persistent homogeneous enhancement with sharp margins (arrow)
Fig. 8.3. Hemangioma, small, MRI findings. A Axial SSTSE image (TE = 80 ms): a bright hemangioma is visible in subphrenic location. B Axial SSTSE image (TE = 120 ms): hemangioma remains bright because of high fluid content. C Axial arterial phase image: Hemangioma shows predominantly peripheral
enhancement that is separated at several points and appears as broken ring (arrow). D Axial delayed phase image: Hemangioma shows complete homogeneous and persistent enhancement
18 Part I – High-Fluid Content Liver Lesions
9Hemangioma II – Typical Medium-Sized with Description of Pathology
Hemangiomas are the most common benign hepatic lesions and occur more often in women. Medium-sized hemangiomas are commonly described on imaging studies because these lesions can be detected and characterized on cross-sectional imaging modalities with confidence.
MR Imaging Findings
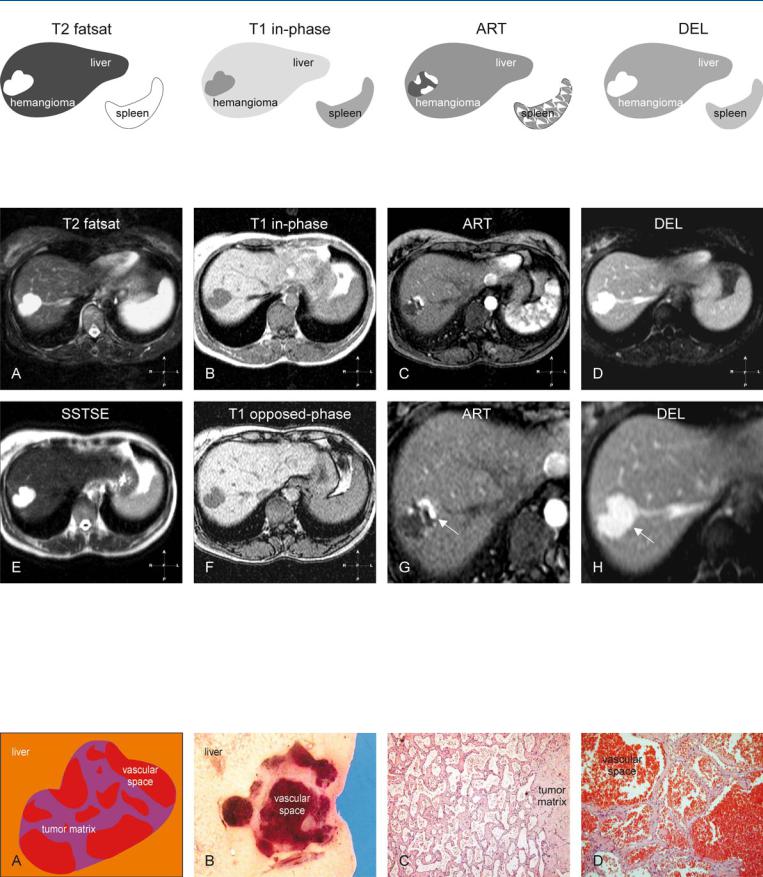
At MR imaging, medium-sized hemangiomas have a characteristic morphology and appearance. These lesions are often lobulated with sharp margins. MRI is more specific than CT and shows hemangiomas as hypointense on T1and moderately hyperintense on T2-weighted images. Medium-sized hemangiomas maintain their high signal on sequences with long TE values (> 120 ms). Most lesions show typical peripheral nodular enhancement in the arterial and portal phases. In the delayed phase, the enhanced parts within the lesion retain contrast longer than the surrounding normal liver tissue. Many lesions may fill-in completely but this is not required for confident diagnosis in typical cases. A combination of moderately high signal on T2-weighted images and peripheral nodular enhancement is very specific and can be considered diagnostic (Figs. 9.1 – 9.3). The findings on delayed images may have added value in atypical cases.
Literature
1.Mitchell DG, Saini S, Weinreb J, et al. (1994) Hepatic metastases and cavernous hemangiomas: Distinction with standardand triple-dose gado- teridol-enhanced MR imaging. Radiology 193:49 – 57
2.Semelka RC, Brown ED, Ascher SM, et al. (1994) Hepatic hemangiomas: a multi-institutional study of appearance on T2-weighted and serial gad- olinium-enhanced gradient-echo MR images. Radiology 192:401 – 406
3.Worawattanakul S, Semelka RC, Kelekis NL, Woosley JT (1997) Angiosarcoma of the liver: MR imaging preand post-chemotherapy. Magn Reson Imaging 15:613 – 617
Differential Diagnosis
For typical medium-sized hemangiomas with high signal on T2 and peripheral nodular enhancement, there is no differential diagnosis. For atypical cases (if either the signal intensity or the enhancement pattern is not quite typical), solid or other vascular lesions with high fluid content may be considered. These may include treated or mucinous metastases and rarely angiosarcoma (may show overlapping features on T2-weighted images but with low signal fibrosis and high signal of hemorrhage on T1-weighted images; peripheral nodular enhancement may not progress toward the center; a combination of these unusual signs should be mistrusted and the lesions should be followed or biopsied).
Pathology
At gross pathology, hemangiomas are lobulated with sharp margins to the liver and often show large vascular spaces. At histology, hemangiomas show large cavernous vascular spaces lined with a single layer of endothelial cells and separated by various amounts of fibrosis tissue and inflammatory cells (tumor matrix).
Treatment
Typical medium-sized hemangiomas do not need any treatment or follow-up with imaging.
9 Hemangioma II – Typical Medium-Sized with Description of Pathology 19
Fig. 9.1. Hemangioma, drawings. T2 fatsat: hemangioma is markedly hyperintense to the liver; T1 in-phase: hemangioma is hypointense to the liver; ART: hemangioma typically shows a peripheral nodular enhancement in the arte-
Fig. 9.2. Hemangioma, typical MRI findings. A Axial fat-suppressed T2-w TSE image (T2 fatsat): Hemangioma is lobulated with high signal intensity to the liver. B Axial in-phase T1-w GRE (T1 in-phase): Hemangioma is hypointense to the liver. C Axial arterial phase post-Gd 2D T1-w GRE image (ART): Hemangioma shows typical peripheral nodular enhancement. D Axial delayed phase GRE image (DEL): Hemangioma shows homogeneous enhancement of the entire lesion (i.e., retainment of contrast in enhanced areas). E Axial T2-w SSTSE image with TE of 120 ms (SSTSE): Hemangioma re-
rial phase; DEL: hemangioma becomes completely enhanced and retains its contrast
mains with high signal on longer TE, which is typical for non-solid lesions such as cysts and hemangiomas. F Axial opposed-phase 2D T1-w GRE image (T1 opposed-phase): Hemangioma has a low signal compared to the liver. G A detailed view from the arterial phase shows more clearly the peripheral nodular enhancement (arrow). H A detailed view from the axial image in delayed phase shows the homogeneously enhanced hemangioma with lobulated contours (arrow)
Fig. 9.3. Hemangioma, drawing and pathology. A Drawing: hemangioma is composed of vascular spaces separated by tumor matrix. B Gross pathology (different patient): hemangioma is lobulated with sharp margins and large vascular spaces. C Photomicrograph shows numerous cavernous vascular
spaces lined with a single layer of epithelial cells, separated by fibrosis and inflammatory cells (tumor matrix). H&E, × 100. D Photomicrograph shows in more detail the vascular spaces and the tumor matrix. H&E, × 200