

20 |
E. Hattingen and M. Warmuth-Metz |
|
|
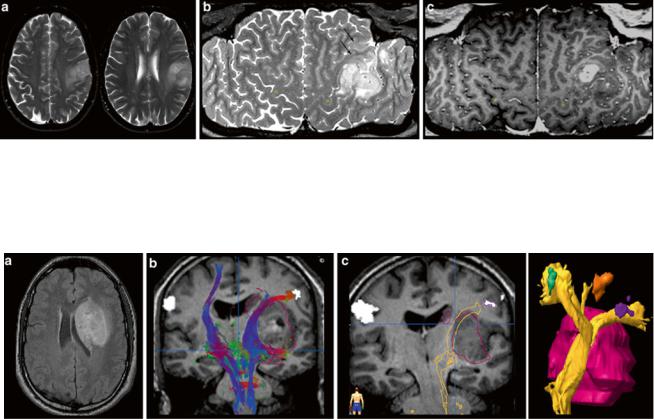
Fig. 9 Exact location of this perirolandic glioma is difficult to define in axial slices (a). The surface-reformatted image depicts the precentral gyrus in whole length, showing the hand knob of the motor hand area (yellow dots in b and c). The tumor including its enhancing part is
Fig. 10 Presurgical DTI and fMRI in brain tumors. FLAIR shows a tumor located in the basal ganglia in a patient with latent hemiparesis (a). Tractography was performed with BrainLab@ using the functional areas of the tongue, hand, and foot in the motor cortex (white spots) as seed region and the cerebral peduncle as target region. In (b) the
located in the postcentral region, but T2-weighted reformatted image (b) clearly shows infiltration into the precentral gyrus and the inferior frontal gyrus (arrows)
corticospinal tract is shown with different color-coded tracking fibers. In (c) preoperative virtually dissected corticospinal tract was transformed in a three-dimensional object which can be integrated into a standard neuronavigation system, allowing for intraoperative visualization of the tracts
becomes more and more important for tumor diagnosis. Up to date, there are only few studies investigating imaging features of brain tumors with different molecular profiles (Aghi et al. 2005; Eoli et al. 2007; Diehn et al. 2008). Considering that these profiles determine the metabolism of the tumor, MR spectroscopy and metabolic imaging with PET should be the methods of choice to recognize molecular pattern (“PET Imaging of Brain Tumors”).
2.4Tumor Monitoring
Monitoring treatment effects on brain tumors becomes more and more complex. In conventional MR imaging, contrast enhancement is the hallmark of tumor growth. However, this imaging feature is more than ambiguous regarding tumor monitoring. On the one side, endothelial cells are sensitive to radiation and chemotherapy and—most often associated with temozolomide treatment—therapy-induced changes
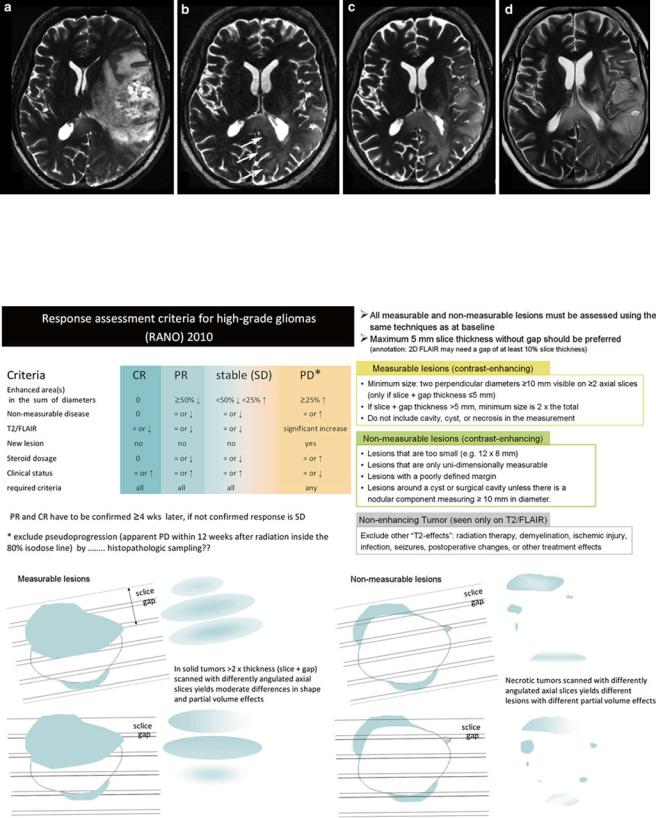
may yield a blood-brain barrier damage with contrast enhancement and mass effect of the treated brain tissue (Fig. 16). Neuro-oncologists introduced the term “pseudoprogression” defining an increased (>25 % in diameter) or new enhancement of irradiated tissue usually detected within 3 months of radiation that subsequently abates without further treatment. This phenomenon is observed in approximately 20–30 % of patients treated with today’s standard therapy for glioblastomas (Brandsma et al. 2008). On the other side, new antiangiogenic treatments normalize the blood-brain barrier damage and thus reduce the contrast enhancement independent from real antineoplastic effects, which is named “pseudoresponse” (Figs. 17 and 18). Being familiar with the imaging features of infiltrative brain tumors may however help to recognize nonenhancing tumors (Fig. 18). Neuro-oncologists are aware of these diagnostic challenges and addressed these problems in their new response criteria for malignant gliomas (Wen et al. 2010).
Figure 19 illustrates these response criteria (RANO) (Wen et al. 2010).
MR Imaging of Brain Tumors |
21 |
|
|

22 |
E. Hattingen and M. Warmuth-Metz |
|
|
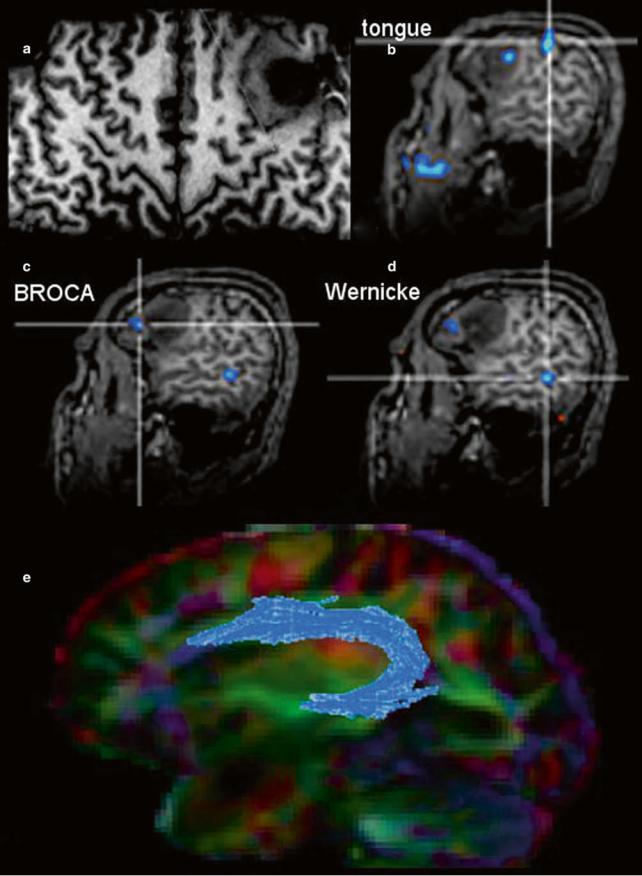
WFig. 11 The surface-reformatted image shows a glioma in the inferior frontal lobe (a). The motor function of the tongue was located behind the tumor, but one activation area was found inside the tumor (b). Patient had a seizure with reversible aphasia. FMRI was performed using verbal subtest of the German Wilde Intelligence Test: The patient is required to find a pair of synonyms out of a set of five words presented
Fig. 12 A large cystic-necrotic tumor abuts the brain surface and is surrounded by huge edema. Margins of the tumor are shapely delineated (arrows in a). The contrast-enhancing rim, which also involves the brain surface (b), shows moderate increase of cerebral blood volume of the tumor margins (c), which does not extend into the surrounding
Fig. 13 Two different gangliogliomas are shown in the temporomesial lobe (a) as the most typical tumor site of glioneuronal tumors and in the occipital lobe (b). Both tumors involve the cortical ribbon and have blurred tumor margins; the occipital tumor has two areas of enhancement (arrows)
simultaneously (Spreer et al. 2002). The frontal language activation area (c) and the temporal language area (d) are both located in the tumor-bearing left hemisphere, which was defined as dominant for language (also confirmed by word generation test). In (e) fiber tracking of the arcuate fascicule (blue) projected on the color-direction map is demonstrated in a patient with a tumor near the temporal pole
brain tissue (which is often seen in glioblastomas). The color-coded FA map (color-direction map) shows that the corticospinal tract (blue area in the right hemisphere) is involved by the edema. The blue indicates diffusion along the inferior/superior axis (d)
MR Imaging of Brain Tumors |
23 |
|
|
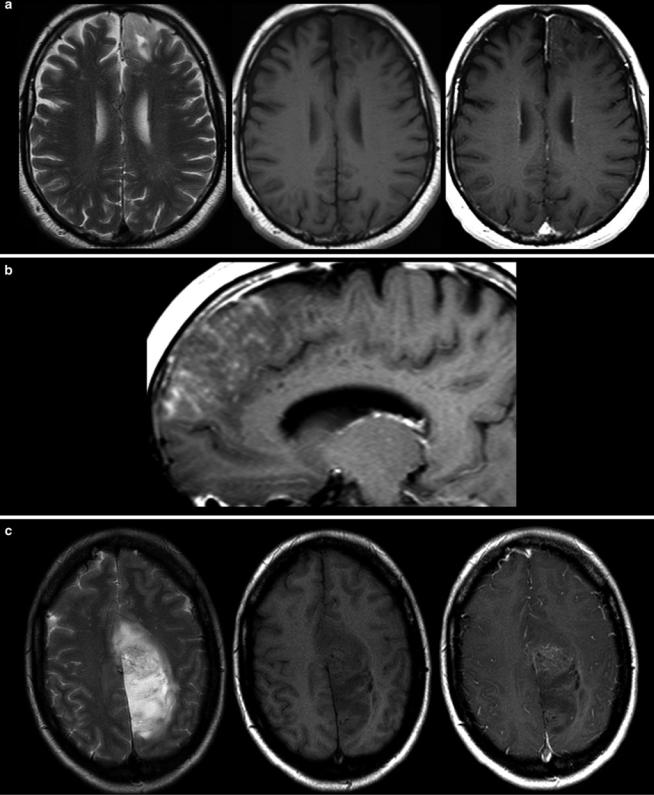
Fig. 14 Two low-grade gliomas with contrast enhancement are shown. A frontal astrocytoma WHO grade II typically infiltrating the cortical ribbon shows faint superficial enhancement (a), which was due to
subpial infiltration of the tumor (b). A large parasagittal oligodendroglioma WHO grade II shows inhomogeneous enhancement in the center of the tumor. It is noteworthy that both tumors have almost no edema
24 |
E. Hattingen and M. Warmuth-Metz |
|
|
Fig. 15 A large frontal astrocytoma WHO grade III is shown with very high signal on T2WI (a) and low T1 signal (b, c). The DWI yields different tumor compartments with a cystic area (low signal), an area with
presumably higher cell density (higher signal, arrow), and the huge tumor mass with intermediate signal. There is at the most faint contrast enhancement (c, e)
The measurement of contrast-enhancing lesions in irregularly shaped, necrotic, and inhomogeneous or ringenhancing lesions is challenging and interobserver variability is high (Vos et al. 2003). The most important issue in monitoring glial tumors is to depict the tumor regardless whether or not it enhances. The imaging features of this nonenhancing tumor were more or less ignored longtime. Nonenhancing tumor, or rather brain tissue which is infiltrated by glioma cells, may look like vasogenic edema or gliosis since each of these entities increases T2 relaxation time and is thereby hyperintense on T2-weighted images. However, there are some imaging characteristics which may help to distinguish edema from brain tumor,
bearing in mind that tumor cells are often found in both normal and edematous brain tissue (see also Figs. 7 and 17).
To guarantee the comparability of images, a standardized protocol should be mandatory, which has not yet been implemented. The slice thickness should not exceed 5 mm in order to minimize partial volume effects (Wen et al. 2010). Sagittal high-resolution 3D sequences might be advantageous to avoid effects from different slice angulations and partial volume effects, but they also have disadvantages considering movement artifacts and T1 contrast (see Figs. 23 and 24). Further, once there is an artifact (e.g., pulsation artifact), it might be reconstructed in three planes (MPR) simulating a real lesion
MR Imaging of Brain Tumors |
25 |
|
|
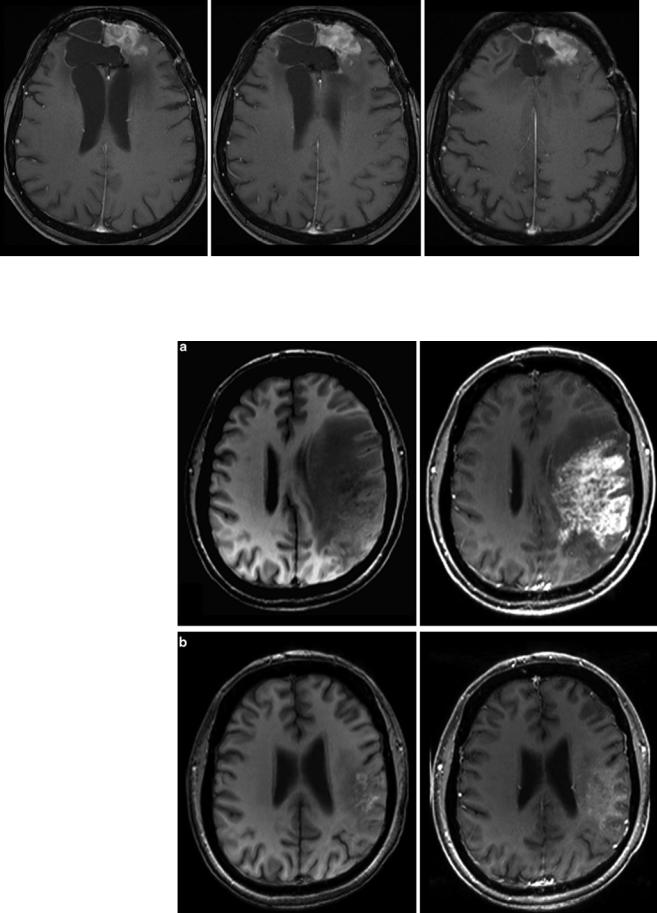
Fig. 16 Patient underwent surgical resection of a frontal glioblastoma and was treated with radiation and temozolomide. The 3 months control yielded new solid enhancement which persisted 2 months later. MR
Fig. 17 Patient had a recurrent glioblastoma, showing mass effect, inhomogeneous tumor area with adjacent edema, and irregular contrast enhancement (a). Four weeks after starting treatment with a humanized monoclonal VEGFantibody, contrast enhancement almost disappeared (b), fulfilling the criteria of partial response concerning the enhancing lesion. T2WI might give more information on treatment response (Fig. 18). Also note the hyperintense areas in precontrast T1WI under antiangiogenic treatment
perfusion was not conclusive due to severe artifacts. Histopathological finding after resection of this contrast-enhancing area did not reveal any tumor cells
26 |
E. Hattingen and M. Warmuth-Metz |
|
|
Fig. 18 Same patient as in Fig. 17: T2W slices before antiangiogenic treatment (a) and 8 weeks after starting therapy show impressive antiedematous effect due to the VEGF antagonism (b). Mass effect and inhomogeneous tumor area also vanished under this drug, and patient’s
hemiparesis gradually resolved. However, some areas show new signal increase (arrows). In the 8-week follow-up (c, d), hyperintense areas mainly infiltrating the cortical areas continuously increase, accompanied with worsening of neurological symptoms
Fig. 19 Updated response assessment criteria for high-grade gliomas: response assessment in neuro-oncology working group (Wen et al. 2010). Further, the difficulties to monitor glioblastomas after surgery leaving a resection cavity are shown for axial slices