

BenHajji F.3D graphical user interfaces.1999
.pdfBibliography
“A man will turn over half a library to make one book”
Samuel Johnson quoted in Boswell’s Life of Johnson, Chap. viii, 1775.
[ABB 1998] |
ABB Network Partner AB, 1998, User’s manual for CAP |
|
531 V1.3, 1MRK 511 056-UEN |
[Andrews 1994] |
Keith Andrews, 1994, Spatial Metaphors for Information |
|
Systems, ECHT94 Workshop on Spatial Metaphors |
[Boyd and Darken |
Casey Boyd and Rudy Darken, Psychological issues of |
1996] |
virtual environment interfaces a CHI 96 Workshop, |
|
SIGCHI Bulletin Vol. 28 nr 4 |
[Burton et al. 1997] |
Nick D. Burton, Alistair C. Kilgour, and Hamish Taylor, |
|
1997, A case study in the use of VRML2.0 for marketing a |
|
product, Department of Computing & Electrical |
|
engeneering Heriot-Watt University |
[Carey and Bell 1997] |
Rick Carey and Gavin Bell, 1997, The Annotated VRML2.0 |
|
Reference Manual, Addison-Wesley Pub Co |
[Carey et al. 1997] |
Rikk Carey, George S. Carson, and Richard F. Puk, 1997, |
|
The Development of the VRML 97 International Standard, |
|
http://www.vrml.org/about/vrml_p1b.html |
[Chen and Czerwinski |
Chaomei Chen and Mary Czerwinski, 1998, Spatial Ability |
1998] |
and Visual Navigation: An Empirical Study, Department of |
|
Information Systems and Computing, Brunel University, |
|
UK |
[Chuah et. al 1995] |
Mei C. Chuah, Steven F. Roth, Joe Mattis, and John |
|
Kolojejchick, 1995, SDM: Selective Dynamic Manipulation |
|
of Visualizations, School of Computer Science |
|
Carnegie Mellon University |
[Conner et al. 1992] |
D. Brookshire Conner, Scott S. Snibbe, Kenneth P. |
|
Herndon, Daniel C. Robbins, Robert C. Zeleznik, Andries |
|
van Dam, 1992, Three Dimensional Widgets, Computer |
|
Graphics (Proceedings of the 1992 Symposium on |
|
Interactive 3D Graphics), ACM SIGGRAPH |
[Corder 1995] |
Michael R. Corder, 1995, NASA AMES RESEARCH |
|
CENTER VERTICAL MOTION SIMULATOR, Sept.issue of |
|
PACIFIC FLYER |
[Darken and Sibert |
Rudy P. Darken and John L. Sibert, 1993, A Toolset for |
1993] |
Navigation in Virtual Environments,. Proceedings of ACM |
|
User Interface Software & Technology |
[Davis 1991] |
William S Davis, 1991, Concepts 3rd ed, The |
|
Benjamin/Cummings Publishing Company, Inc, |
[Embretsen 1998] |
Joachim Embretsen, 1998, Development of Relay Setting |
38
|
Tool for Protection Terminals, Master of Science thesis |
|
work for the Engineering Physics program at Uppsala |
|
University |
[Gabriel 1985] |
Pavel Gabriel, 1985, Oscar Reutersvärd omöjliga figurer i |
|
färg , Bokförlaget Doxa AB |
[Gibson 1984] |
William Gibson, 1984, the Matrix, Ace Books |
[Goldberg and Hiller |
Stephen L. Goldberg and Jack H. Hiller, 1995, Simulator |
1995] |
Sickness in Virtual Environments, Technical Report 1027, |
|
U.S. Army Research Institute for the Behavioral and Social |
|
Sciences |
[Govil-Pai 1998] |
Shalini Govil-Pai, 1998, Learning Computer Graphics: |
|
From 3D Models to Animated Movies on Your PC, Springer |
|
Verlag. |
[Hand 1997] |
Chris Hand, 1997, A Survey of 3D Interaction Techniques, |
|
The Eurographics Association, Blackwell Publishers |
[Hinckley 1996] |
Ken Hinckley, 1996, Haptic Issues for Virtual |
|
Manipulation, In Partial Fullfillment of the Requirements |
|
for the Degree Doctor of Philosophy (Computer Science), |
|
University of Virginia |
[Höök and Dahlbäck |
Kristina Höök and Nils Dahlbäck, 1997, Designing |
1997] |
navigational aid for individuals, CHI 97 Workshop om |
|
Navigation in Electronic Worlds, |
[Jul and Furnas 1997] |
Susanne Jul and George W. Furnas, 1997, Navigation in |
|
Electronic Worlds: A CHI 97 Workshop, SIGCHI Bulletin |
|
Vol. 29 nr 4 |
[Kallinikos 1996] |
Jannis Kalinikos, 1996, Organizations in the Age of |
|
Information, Academia Adacta AB |
[Kilgard 1993] |
Mark J. Kilgard, OpenGL and X, Part 1: An Introduction, |
|
The X Journal November/December Issue 1993 |
[Kotler 1997] |
Philip Kotler, 1997, Marketing Management, Prentice Hall |
[Lampton 1994] |
Chistopher Lampton, 1994, Gardens of imagination, Waite |
|
Group press |
[Marrin 1997] |
Chris Marrin, Proposal for a VRML 2.0 Informative Annex - |
|
External Authoring Interface Reference, |
|
http://www.vrml.org/WorkingGroups/vrml- |
|
eai/ExternalInterface.html#1.1 |
[Marrin et al 1997] |
Chris Marrin, Rick Carey, and Gavin Bell 1997, ISO/IEC |
|
14772.1:1997 Virtual Reality Modelling Language |
|
(VRML97), The VRML Consortium Incorporated |
[Media Lab 1998] |
Media Lab, 1998, Master of View, Media Lab University of |
|
Art & Design Helsinki UIAH, |
|
http://www.mlab.uiah.fi/nmc/stereo/masters/ |
39
[Mullet et al 1995] |
Kevin Mullet, Diane J. Schiano, George Robertson, Joel |
|
Tesler, Barbara Tversky, Kevin Mullet, 1995, 3D or Not |
|
3D: “More is Better” or “Less is More”?, In proceedings |
|
of CHI 95 |
[Neider et al. 1993] |
Jackie Neider, Tom Davis, Mason Woo, 1993, OpenGL |
|
Programming Guide, Addison-Wesley |
[Norman 1988] |
Donald A. Norman, 1988, The Design of Everyday Things, |
|
Doubleday |
[Preece et al. 1994] |
Jenny Preece, Yvonne Rogers, Helen Sharp, David Benyon, |
|
Simon Holland, Tom Carey, 1994, Human-Computer |
|
Interaction, Addison-Wesley Publishing Company |
[Sanders and Gay |
Donald Sanders and Eben Gay, 1996, VRML-Based Public |
1996] |
Education—an example and a vision, |
|
http://www.vrmlsite.com/dec96/spot2.html |
[Satalich 1995] |
Glenna A. Satalich, 1995, Navigation and Wayfinding in |
|
Virtual Reality: Finding Proper Tools and Cues to Enhance |
|
Navigation Awareness, Master of Science thesis in |
|
Engineering, University of Washington |
[Segal 1994] |
Mark Segal, Kurt Akeley, 1994, The Design of the OpenGL |
|
Graphics Interface, Silicon Graphics |
[Simon 1984] |
David E. Simon, 1984, GRAFIK till din PC, Pagina Förlags |
[Smith 1993] |
Ronald E. Smith, 1993, PSYCHOLOGY, West Publishing |
|
Company |
[Smith et al. 1982] |
David Canfield Smith, Charles Irby, Ralph Kimball, and |
|
Bill Verplank, 1982, Designing the Star User Interface, |
|
Byte |
[Stål and Andersson |
Olov Ståhl and Magnus Andersson, 1997, DIVE - A Toolkit |
1997] |
for Distributed VR Application, |
|
http://www.sics.se/dce/dive/online/ercim.html |
[Wernecke 1994] |
Josie Wernecke, 1994, The Inventor Mentor : |
|
Programming Object-Oriented 3d Graphics With Open |
|
Inventor, Addison-Wesley |
[Wiss and Carr 1998] |
Ulrika Wiss and David Carr, 1998, A Cognitive |
|
Classification Framework for 3-Dimensional Information |
|
Visualization, Research report LTU-TR--1998/4--SE, |
|
Luleå University of Technology |
[Young 1996] |
Peter Young, 1996, Virtual Reality Systems, Centre of |
|
Software Maintenance, University of Durham, |
|
http://www.dur.ac.uk/~dcs3py/pages/work/documents/inde |
|
x.html |
40

Appendix A
User Interfaces of Applications of ABB Network Partner
To identify potential application areas for 3D interfaces within ABB Network Partner we have studied the user interfaces of several of the companies existing applications.
We will look at four different applications, Configuration and Programming Tool 531, S.P.I.D.E.R., Parameter Setting Tool, and Integrated Data Engineering System/Restructured Data Engineering.
Appendix A gives a brief description of the functionality and user interfaces of the applications
Configuration and Programming Tool 531
The configuration of protection and control terminals in power stations is carried out by a tool called the Configuration and Programming Tool 531 (CAP531), which allows the user to configure the terminal by manipulating graphical symbols.
CAP 531 is used throughout all stages of a project, from engineering to testing, commissioning, documentation, and maintenance. The user can remove and add connections between different function blocks in order to achieve required functionality. A number of free logical elements (AND, OR, Timers, etc.) enables configuration of different customer-specific solutions. [ABB 1998]
Various function blocks can be combined either as pre-determined or custom-designed schemes. This means that an output signal from one function block can be used as an input signal to another function block. External signals can be used to block or enable a certain function.
A monitoring function offers an online check of all internal signals in an object terminal. This function offers the user a powerful help tool by which the user can see the changes in a signal status.
Besides the obvious tool-, status-, and menu bars in The CAP 531 interface, the main screen comprises three different views: the project tree, the work sheet and the page layout.
The project structure, as shown in figure 1, is displayed as a tree, and allows the users to freely build up the structure and select the number of levels. From the project tree menu bar and toolbar, the user can insert items and edit the project tree, copy work sheets and copy terminals.
Figure 1 the project structure of CAP 531 is displayed as a tree.
41
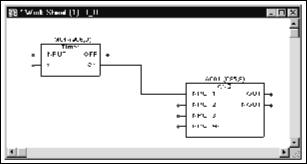
The configuration work is done in work sheets. All functions in the terminal are entered in the work sheet as function blocks. All internal logical interconnections between the functions are drawn as lines between the function blocks (see figure 2). From the work sheet menu bar and toolbar, the user can perform actions to quickly create configurations. The user can also debug the configuration in the work sheet. This is an online function that displays all signal levels of all internal signals in a terminal with different colours of the lines in the work sheet.
Figure 2 The two objects are connected in the work sheet.
Finally, the page layout is the drawing form of the configuration drawings. It is used to adjust the drawing format of the work sheet pages that are going to be printed. For example, allowing the user to adapt the header and footer and insert order number, terminal type, names, the printing date and time, bitmap files etc.
S.P.I.D.E.R.
The Supervise Power Infrastructure to Develop Efficiency and Reliability (S.P.I.D.E.R.) concept establishes a framework for information management in a power company. It constitutes the kernel for horizontal integration when connecting centralised computing resources. S.P.I.D.E.R. also facilitates the vertical integration by connecting plant-computing resources in power stations and substations to a central position for monitoring and control of all aspects of the electronic network. This spans the entire network stretching from power generation through interconnected transmission grids to distribution networks. [ABB 1998]
S.P.I.D.E.R. consists of a graphical user interface and by using direct manipulation a user can pan the map of an entire network. In an effort to avoid clutter, the user can zoom in or out of the map to change the level of detail and thereby display or hide objects. All functions are controlled using pull-downs and pop-up menus or icons.
Various background maps can be entered as a data file into the system and used as a basis for the network presentation. A network colouring function displays the real time switching state of the network. Changes of a switching device will cause an immediate recolouring on the map. The network can also be coloured according to the types of cables, strong and weak conductors, etc. If a station is chosen, a wiring diagram of the station containing parameters and data is displayed with graphical symbols representing different objects in the station (see figure 3). This allows the operator to monitor and control a wide range of electricity supply functions.
42

Figure 3 Screenshot from S.P.I.D.E.R.
Parameter Setting Tool
Programmable Logic Controllers (PLCs), are used in power transmission contexts for protection and control of power stations and high-voltage lines. The PLCs are located in power stations and are used to check the currents and voltages in the grid. ABB Network Partner is manufacturing them as protection and control terminals. Substation Monitoring System (SMS) is one of the tools used for handling, storing, and monitoring the information inside the terminals. The information includes amongst other things parameters. A prototype called the Parameter Setting Tool (PST) is a web based improved subset of SMS that is used for reading and writing these parameters. [Embretsen 1998]
A power system can consist of hundreds of stations, each station including up to twenty bays, and thousands of PLCs for control and protection. The PST organises the power system using a tree structure called the Navigator.
Users navigate through the structure by expanding the nodes in the tree. The Navigator in PST reminds of the Windows NT Explorer (see figure 4). Different parts of the structure can be physically located in different places, but this is transparent to the user. One part can for example be located on a central server while another resides on a station computer. From the users point of view it looks as if the whole structure is residing on the same machine.
When the user has navigated through the tree, he finally reaches some kind of leaf that represents some kind of tool functionality. When the user clicks on that leaf the Form Manager starts, which presents the parameters in the terminal corresponding to the node. Parameters are presented on a form and are grouped with tab strips and headers. A description of each parameter is available through a tool tip that appears when the cursor is over a control. Writing in the edit fields modifies the values of the parameters.
43

Figure 4 A user navigates through the structure of the Parameter Setting Tool by the nodes in the tree, and the parameters are presented on a form.
Integrated Data Engineering System/Restructured Data Engineering
Integrated Data Engineering System/Restructured Data Engineering (IDES/RDE) is a merger of two data-engineering systems. Both systems are used to design the tables and fields of the database used in S.P.I.D.E.R.7
Integrated Data Engineering System (IDES) facilitates database design by providing a graphical user interface, but to insert the database in the S.P.I.D.E.R. system extensive conversion routines have to be used. Restructured Data Engineering (RDE) on the other hand uses a form based input that results in a database that is very similar to the one used in S.P.I.D.E.R.. In an effort to combine the best parts from both systems, IDES/RDE is designed to use the GUI from IDES and the database from RDE. The GUI uses direct manipulation with graphical symbols representing different objects in the database. A completed definition of a database faintly resembles a map with power stations represented as squares with lines between them to show connections. Inside power stations are other objects with differing graphical representations (see figure 5).
To prevent cluttering of the display the map contains multiple levels of detail. Each graphical object has an attribute to indicate on which level of detail the object will be visible. It is up to the user how he wishes to use this feature, but on the top-level usually only power stations and their connections are visible. When the user scales the map to a lower level of detail other objects are revealed e.g. objects inside power stations.
With IDES/RDE it is also possible to edit the database from different control centres simultaneously. To prevent conflicts and loss of data when two users try to edit the same fields in the database simultaneously a system of locked areas is used. To edit a part of the database the user selects a part of the map with the mouse to lock it and make sure no one else
7 The information in this section originates from a demonstration of the application carried out by Åsa Mosskull, ABB Network Partner 1998.
44

can edit that area. To other users, the locked areas are visible as areas that differ in colour from the background. Each graphical object is also colour-coded to indicate from which site the object originates.
To facilitate the input of data regarding power stations the background of the GUI can be set to display a map of the region so that object placement on the screen has a connection to the real world.
Figure 5 Screenshot from IDES/RDE.
45
Appendix B
Glossary of Abbreviations
2D |
Two Dimensional |
3D |
Three Dimensional |
ABB |
Asea Brown Boveri |
API |
Application Programming |
|
Interface |
CAD |
Computer Aided Design |
CAP |
Configuration and |
|
Programming Tool |
CBI |
Character Based Interface |
CSCW |
Computer Supported |
|
Cooperative Work |
DIVE |
Distributed Interactive |
|
Virtual Environment |
DOF |
Degrees Of Freedom |
EAI |
External Authoring |
|
Interface |
FSN |
File System Navigator |
GUI |
Graphical User Interface |
HCI |
Human computer |
|
Interaction |
HMD |
Head Mounted Display |
HTML |
HyperText Markup |
|
Language |
IDES |
Integrated Data |
|
Engineering System |
OS |
Operating System |
Pixels |
Picture Elements |
PLC |
Programmable Logic |
|
Controllers |
PST |
Parameter Setting Tool |
RDE |
Restructured Data |
|
Engineering |
SMS |
Substation Monitoring |
|
System |
46
VE |
Virtual Environments |
VR |
Virtual Reality |
VRML |
Virtual Reality Modelling |
|
Language |
WIMP |
Windows-Icons-Menus- |
|
Pointer |
WYSIWYG |
What You See Is What |
|
You Get |
47