

01 POWER ISLAND / 02 H2+NH3 / Royal Swiss 2024 Techno-Economic Analysis of Wind Power-to-Hydrogen
.pdfelectric vehicles have already achieved a degree of accessibility from its mostly well-established infrastructure. Therefore, resulting in a high number of electrified cars on the road, whereas heavy hydrogen-fueled vehicles primarily exist as prototypes and the number of HRS in Sweden is low. Sweden currently possesses a total of five refueling hydrogen stations, however, more will be installed in near future [20]. Table 1 shows what the estimated hydrogen consumption would be based on the vehicle category.
Table 1. Hydrogen fuel consumption and road range categorized by vehicle type [14].
Vehicle Category |
Fuel Economy |
Driving Range |
Hydrogen Consumption |
||
|
|
|
|
|
|
|
|
|
|
|
|
Private Car |
1 [kg/H2/100 km] |
20–40 |
[km/day] |
0.2–0.4 |
[kg H2/day] |
Taxi |
1 [kg/H2/100 km] |
100–200 |
[km/day] |
1–2 |
[kg H2/day] |
Bus |
8 [kg/H2/100 km] |
100–200 |
[km/day] |
8–16 |
[kg H2/day] |
|
|
|
|
|
|
Today, there are some lightweight hydrogen-vehicles available to purchase. These cars can be viewed as an intermediary accelerator that contributes to the transitioning process from dieselfueled to hydrogen-fueled vehicles on the road. Toyotas Mirai and Hyundai Nexo are some examples of such cars. These two have been commercially available since 2015 and the vehicle’s respective cost and driving range are listed in Table 2 [14].
Table 2. Technical and economic information about light-weighted hydrogen fueled vehicles [14].
Vehicle Model |
Vehicle Costs |
Fuel Consumption |
|
|
|
|
|
|
2021 Toyota Mirai XLE |
45500 [€] |
0.82 [kg/H2/100 km] |
2021 Toyota Mirai Limited |
60700 [€] |
0.97 [kg/H2/100 km] |
Hyundai Nexo |
85000 [€] |
1.09 [kg/H2/100 km] |
|
|
|
Furthermore, a hydrogen-fueled bus is estimated consume around 8–9 kg/H2/100 km. This makes buses that travels long distances, in terms of green transportation, suitable to operate on hydrogen compared to buses driving short distances, which instead can be electrified. Nevertheless, in 2022, two hydrogen-fueled busses have started operating in Sandviken, Sweden, where the aim is to promote usage of hydrogen-fueled vehicles [14].
In Sweden, there are some trains operating on diesel fuel due to some routes lacking overhead electrical lines. The construction cost of electrical overhead lines on these routes is too expensive, making diesel a financially viable option. Thus, continuing operating these trains on diesel. In such scenarios, electrification of these trains by hydrogen could be an option. A research study has indicated that a train with 3–4 wagons, consumes approximately 22–36 kg/H2/100 km [14].
2.3 Power-to-X
The concept of "Power-to-X" was initiated in Germany in 2010, which involves producing energy carriers (denoted as “X”) from RES. These energy carriers are for example hydrogen, methane, and ammonia, where the respective production process is referred to as "Power-to-Hydrogen" (PtH), "Power-to-Methane" (PtM), and "Power-to-Ammonia" (PtA). Furthermore, these energy carriers may be used in a wide range of applications within transportation, industrial and energy sectors. Therefore, "Power-to-X" is widely recognized as a promising strategy that contributes to low-carbon economy by decoupling the energy supply from fossil fuels [21].
19

The term “X” can also represent regenerated electricity, which is produced by applying fuel cell technology. Specifically, the fuel cell will act as an electrochemical converter that transforms the energy carrier back into electrical energy. This method is recognized as “Power-to-Power” (PtP).
The PtP method has the potential to compensate for the intermittent nature of renewable energy by storing surplus electricity produced when the demands are low compared to production and regenerating it at high demands compared to production [21].
The primary focus of this thesis will be the PtH process presented in section 2.3.2, with a brief review of PtP in section 2.3.1.
2.3.1 Power-to-Power
The Power-to-Power (PtP) concept includes the conversion of an energy carrier back electricity, typically through a fuel cell. Fuel cell technology resembles the operation of a battery. It the converts chemical energy into electrical energy with an electrical efficiency ≥40% and is commercially available in several variations: PEM fuel cell, DMFCs, and AFCs, among others. Furthermore, fuel cells are versatile and possess several benefits, including flexibility, off-grid applicability, and base load capacity. These properties are required for a fuel cell in order to operate at a large-scale application, where coupling to an intermittent energy source is involved.
Additional advantages are no generation of pollutants, such as nitrous oxides (NOx), sulfur oxides (SOx), and volatile organic compounds (VOC), resulting in a reduced environmental footprint [22].
The operating principles of a fuel cell, regardless of its technology, follow the Nernst equation. However, the difference between these cells lies in the types of reactions taking place at electrodes, which in turn depends on whether it is anionic or protonic conduction that occurs through the electrolyte [22].
In the case of hydrogen being the energy carrier, PtP can be regarded as a reversed process of PtH where the oxygen acting as the oxidizing agent, and water is the only byproduct. The redox-
reaction consists of splitting H2(g) molecules into protons and electrons at the anode side of the cell, while air is fed to the cathode. Thereafter, for e.g., a PEM fuel cell, the electrons (e-) flow through an external circuit, generating electricity, while the protons (H+) pass through an electrolyte membrane to produce water at the cathode by combining with the air’s oxygen (O2) [22]. A general illustration of operating principles for different types of fuel cells are shown in Figure 3.
Figure 3. General illustration of various fuel cells operating principles [23].
20
As previously mentioned, a PtP concept is a strategy to store excess electricity produced by intermittent power sources when the demand is low in hydrogen for future utilization. The preserved hydrogen can later be used to re-generate electricity during periods of high demands and supply it to the grid as seen in Figure 4. This approach has the potential to reduce wastage of excess electricity that would otherwise go unused [22].
Figure 4. Generalized configuration of the Power-to-Power process.
Overall, fuel cells have presented numerous advantages over traditional power generation technologies, such as achieving clean and efficient generation of electrical power. However, the widespread implementation of fuel cells is limited due to some challenging factors, for example high investment cost and limited infrastructure. Nonetheless, there are ongoing research and development efforts aimed to address these challenges [22].
2.3.2 Power-to-Hydrogen
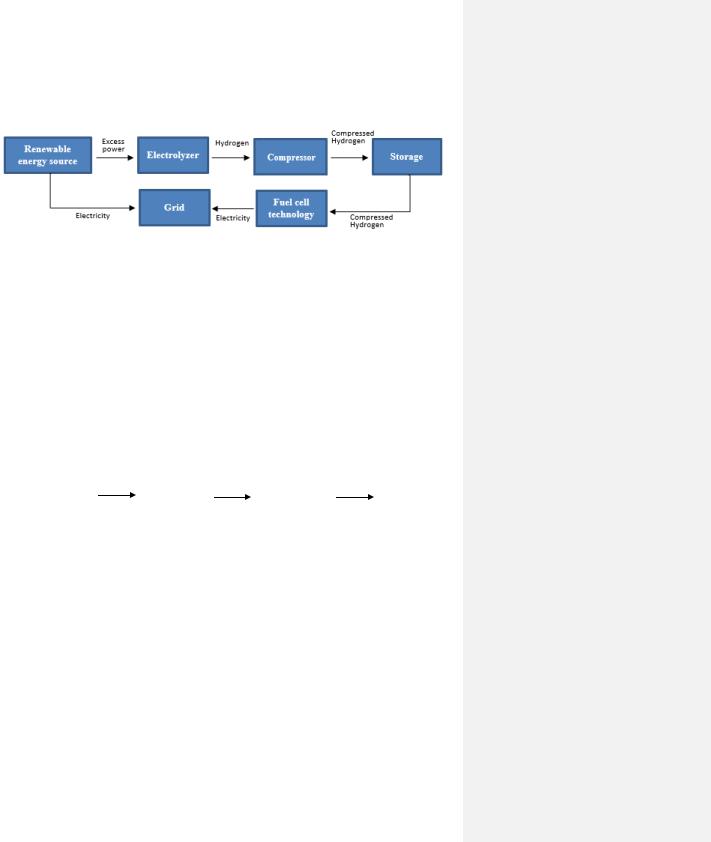
The Power-to-Hydrogen (PtH) process is the backbone to the concept of PtX [21]. Essentially, it involves storing electricity (generated from RES) in hydrogen (energy carrier) by powering an electrolyzer, as illustrated in Figure 5. Thereafter, the hydrogen is stored, and this can occur in different ways. One example is hydrogen undergoing compression to until a specific pressure is obtained before being stored as is seen in Figure 5.
Renewable |
|
Electrolyzer |
|
Compressor |
|
Storage |
energy source |
|
|
|
|||
|
|
|
|
|
|
|
|
|
|
|
|
|
|
|
|
|
|
|
|
|
Figure 5. Generalized configuration of a Power-to-Hydrogen process.
Moreover, given that the hydrogen production facility is coupled to an intermittent energy source that has a fluctuating operation, it is necessary for the electrolyzer to exhibit flexible characteristics to adapt and effectively manage the dynamic operation. Furthermore, the deployment of PtH is geographically flexible, but it faces certain challenges, such as the high capital cost of equipment in the form of electrolyzer and storage. However, PtH is still considered to be a highly promising technology that promotes production of sustainable fuels and eco-friendly feedstocks. This is evidenced by its globally growing interest, especially within the field of energy research [21]
2.4 Mid Sweden Hydrogen Valley
The Mid Sweden Hydrogen Valley is a collaboration effort between industries, transport sector, public sector, and academic institutions. This project is taking place in bidding area two and has the aim to establish hydrogen infrastructure in central Sweden. Bidding area two is an ideal region for such project due to its well-established steel and paper industries located in the area, besides the low spot prices. Additionally, hydrogen has been tested within the transportation and industry
21

sector in this region. Moreover, Svea Vind Offshore has scheduled to start producing hydrogen from an electrolyzer that is powered by the grid, in Gävle harbor in 2023. Already in 2021, Svea Vind Offshore has signed an agreement to supply hydrogen to the transport company Maserfrakt, where it will be used as a fuel. Maserfrakt is Sweden’s largest construction machine supplier and transport company and is currently operating in bidding areas 1–2. Maserfrakt is also planning to invest in an HRS, which will be situated in Borlänge.
2.5 Bidding Area Two
The Swedish electricity market is divided in four bidding areas, with the areas 1 and 2 (SE1 and SE2, respectively) located in the northern part of the country, while areas 3 and 4 (SE3 and SE4, respectively) are situated in the south, as illustrated in Figure 6. Renewable energy such as hydro and wind power facilities are primarily located in the north due to the areas’ favorable water and wind conditions as seen in Table 3–4. These tables shows that the bidding areas 1–2 are dominant producers of wind and hydro energy. In contrast, southern Sweden possess some renewable energy sources such as wind and solar energy, however, it relies heavily on nuclear power plants (Oskarshamn, Forsmark and Ringhals) to meet its electricity demand.
In comparison to the north, the bidding areas 3–4 are more densely populated, and therefore has a high electricity consumption. As a result, areas 1–2 have a surplus of electricity, while the areas 3–4 experience an electricity deficit. Therefore, areas 3–4 also relies also on the areas 1–2 to deliver electricity to meet their high electricity demand.
The electricity price depends on the balance between supply and demand, as well as the grids’ capacity to distribute electricity from the north to the south.
As indicated in Table 5, the electricity surplus in bidding areas 1–2 leads to a significantly lower average spot price in these areas compared to the average
spot price of the areas 3–4. Moreover, the relatively low spot price and surplus renewable energy in the north makes it an attractive geographical location for industries to expand. Thus, the initiative of launching the "Mid Sweden Hydrogen Valley" in central Sweden, which aims to produce green hydrogen from RES and utilize it as green fuel in the transportation sector.
Table 3. Total annual wind power production per bidding area [25].
Bidding Area |
|
Year 2019 |
Year 2020 |
Year 2021 |
|||
|
|
|
|
|
|
|
|
|
|
|
|
|
|
|
|
1 |
|
2.47 [TWh] |
4.01 |
[TWh] |
4.61 |
[TWh] |
|
2 |
|
6.32 [TWh] |
10.57 |
[TWh] |
10.80 |
[TWh] |
|
3 |
|
6.91 [TWh] |
8.53 |
[TWh] |
8.04 |
[TWh] |
|
4 |
|
4.20 [TWh] |
4.48 |
[TWh] |
4.01 |
[TWh] |
|
|
|
|
|
||||
|
Table 4. Total annual hydro power production per bidding area [25]. |
|
|
||||
Bidding Area |
|
Year 2019 |
Year 2020 |
Year 2021 |
|||
|
|
|
|
|
|
|
|
|
|
|
|
|
|
|
|
1 |
|
18.5 [TWh] |
19.0 |
[TWh] |
22.1 |
[TWh] |
|
2 |
|
35.0 [TWh] |
40.7 |
[TWh] |
38.8 |
[TWh] |
|
3 |
|
10.3 [TWh] |
11.0 |
[TWh] |
11.4 |
[TWh] |
|
4 |
|
1.30 [TWh] |
1.30 |
[TWh] |
1.31 |
[TWh] |
|
|
|
|
|
|
|
|
|
22
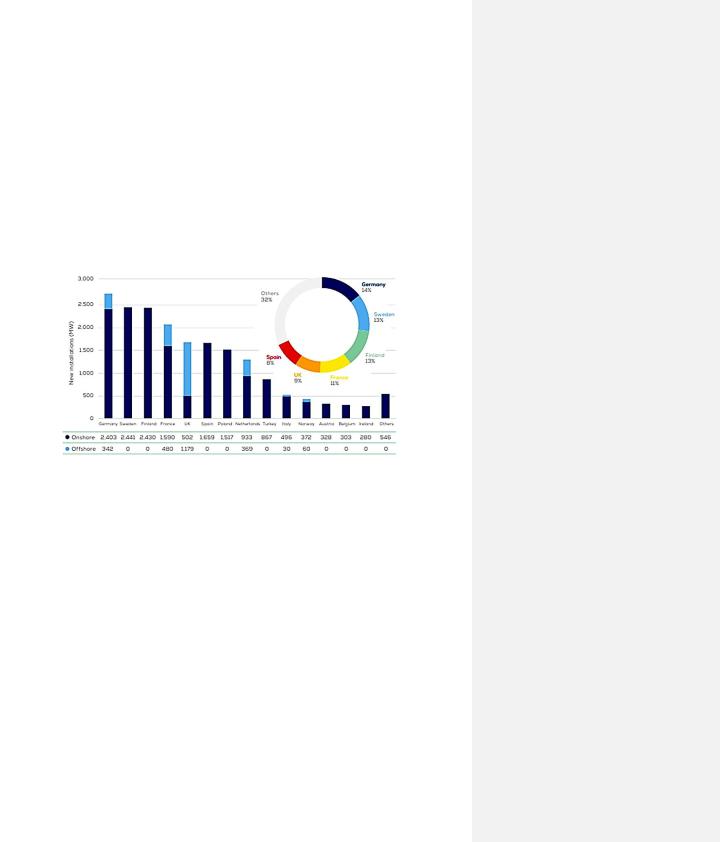
Table 5. Average spot price per bidding area [26].
Bidding Area |
Year 2019 |
Year 2020 |
Year 2021 |
|
|
|
|
|
|
|
|
|
|
|
1 |
40.10 [€/MWh] |
15 |
[€/MWh] |
43.2 [€/MWh] |
2 |
40.10 [€/MWh] |
15 |
[€/MWh] |
43.3 [€/MWh] |
3 |
40.55 [€/MWh] |
22.1 |
[€/MWh] |
67.0 [€/MWh] |
4 |
42.09 [€/MWh] |
26.9 |
[€/MWh] |
81.7 [€/MWh] |
|
|
|
|
|
2.6 Wind Power Parks in Europe
Europe has until now successfully installed 255 GW of wind power capacity, of which 87% comprises onshore wind plants. As indicated by the European wind report, Germany, Sweden, Finland, and France were the countries with the highest number of installations in 2022, as demonstrated in Figure 7 [27].
Figure 7. Shows installation of wind power plants in different countries [27].
Sweden was placed as the second highest ranking in wind capacity installations in 2022. The previous year, Sweden has also set a national record in Europe by installing the most wind capacity (onshore) in a single year, where the capacity increased from 2.1 GW to 2.4 GW. Despite this, it is noteworthy that the total power generated from wind energy by the EU+UK, only accounted for 17% of the total electricity demand in 2022 [27].
Europe plans to install an additional 129 GW of wind capacity between 2023 and 2027, of which 3/4 will comprise onshore wind plants. Furthermore, in order to meet the 2030 Climate and Energy goals, a minimum of 30 GW of wind capacity would be required to be installed in Europe per year [27]. These goals aim to achieve that 32% of the consumed electricity will be from renewable energy sources (RES) by 2030 and assist countries in achieving the emission reduction commitments, according to the Paris Agreement [28]. Therefore, the installation of RES, especially wind energy, will continue to accelerate.
2.6.1 Development of Wind Turbines Technology
The advancement of wind turbine technology has undergone rapid development with the aim of improving its competitiveness, particularly in terms of its nominal power and capacity factor. The nominal power is related to the turbine’s features such as rotor diameter and hub height, which
23

have over time significantly increased, as seen in Figure 8. The capacity factor is a unitless ratio, which is obtained by dividing the average power output generated over a period of time by the wind turbine by its maximum peak capacity. This measure provides insight into the difference between the actual power produced and the hypothetical maximum power that could be produced by the turbine [29].
Figure 8. Shows the physical development of wind turbines [29].
The concept behind this technology development involves maximizing the power output by increasing dimensions of the turbines’ physical size. This includes for example increasing the length of the blades to capture more wind. In the case of an offshore wind farm, a larger turbine size has been found to enhance the capacity factor. An example is a that a 3 MW windmill in year 2010, had a capacity factor of 38%, which increased to 43% when the capacity increased to 5.5 MW. It is important to note that this outcome is not always guaranteed as the capacity factor is also dependent on the specific wind conditions at the given site [29].
While larger wind turbines have demonstrated the capability of improving the capacity factor of windmills, the large dimensions pose some challenges. The challenges include higher investment costs and more complex construction, often requiring larger foundations sites. However, larger turbines generally have lower specific operational and maintenance costs, leading to a reduction in the levelized cost of electricity (LCOE) [29]. The LCOE is the total costs of a power producing unit over its entire lifetime divided by the total amount of electricity produced. For windmills, it can be approximated by dividing the capital cost of the wind plant by the total electricity produced. This calculation provides a means of determining the minimum electricity price required for a particular wind park to become financially viable over its lifetime [30]. This is an indirect way to see the impact that the wind conditions have on the electricity prices, where good wind conditions lead to a more cost-effective plant due to increased electricity production. As the result, lower spot prices will be obtained if the share of wind power is sufficiently large to affect the market, as described in section 2.5.
2.7 The Swedish Electricity Market
The Swedish electricity market consists of several independent units, where each unit handles different parts of the electricity market. The types of, and the relation between, these units are listed below and are illustrated in Figure 9, respectively.
System manager: Svenska Kraftnät (SvK) operates and manages the Swedish electricity market.
Producer: |
Produces electricity. |
24

Grid Owner: |
Manages transmission, regional, and local grid. |
Electricity trading |
Purchase electricity from a producer and sell it to customers. |
companies: |
|
Electricity |
E.g., Nord Pool, where the electricity trading process takes place. |
Marketplace: |
|
The grid owners manage the electricity transportation from the production site to end users. As seen in the list above, there are grids at different levels, which all are owned by different companies depending on which region being viewed. The local grid is for example primarily owned by E. ON, Vattenfall and Fortum in Sweden but there are also a number of other grid owners. However, the transmission grid is owned and operated by SvK, which also manages the overall Swedish electricity market. This type of management involves among other things, efficient trading of electricity within Sweden as well as with other European countries. Additionally, SvK ensures that production and imports of electricity equals consumption and exports [31][32].
The operational process involves transporting the generated electricity from the production site to the transmission grid via a connecting point, operating at high voltages (400-220 kV), to the local grid (<40-230 kV) via the regional grid (40-130 kV), which acts as an intermediate grid. At some points, the generated electricity is directly supplied to the regional grid as seen in Figure 9. Once the electricity reaches the local grid, it will be distributed to and purchased by end users, such as households and industries, by the electricity trading companies [31][32]. The electricity price, socalled spot price, is set according to the supply and demand, where the exchange marketplace primarily takes place on the market Nord Pool.
Transmission Grid
Producent |
Regional grid |
|
End users
Local grid
Electricity trading companies
Nord Pool
Figure 9. Shows the interaction between the different units [32].
2.7.1 Grid Connection
In order for a producer to obtain accessibility to the grid to supply electricity, a so-called transmission grid tariff must be paid. The tariff can further be divided into two different types of costs: a varying and fixed cost. The fixed cost, power fee [€/MW], is the cost of coupling the electricity production facility to a connecting point for the purpose of distributing electricity. The income collected from the power fee will be used to cover the investment costs of technically connecting the wind power plant to the grid and the O&M of the grid. The varying fee is called the energy fee [€/MWh] and it corresponds to the cost of electricity input to the grid. The income
25

of this fee will be used to cover the costs of electrical losses in the network and must be paid by all large-scale power plants, for example wind power plants with capacity larger than 1 500 kW. Plants with lower capacity are classified, according to Swedish law (4 chapter 10§), as small-scale electricity production facilities and are not required to pay the energy fee [32].
Moreover, in Sweden, the price of the energy fee is a function of the geographical location of the connection point. Meaning, the tariff’s price, will vary depending on which bidding area is being viewed as well as the regional location of the connecting point. Based on this, power producers in northern Sweden belonging to the bidding area 1 and 2, are obligated to pay an energy fee to compensate for its high electricity production compared to southern Sweden. However, in the south, the energy fee will be received as a payment from SvK to the producers due to its relative low electricity production. The aim is to compensate for the high load on the grid in northern Sweden and to balance out the electricity prices between the bidding areas [33][34].
The power fee [€/MW] is based on the capacity size of the production facility, while the energy fee [€/MWh] is calculated according to equation (11) [33][34].
Energy Fee = (Pt,e + r) ∙ F |
(11) |
where Pt,e is the price of the electricity exchange's day-ahead trading per hour in the respective bidding area. The loss coefficient is denoted as F, and r is the SvK risk surcharge for the connection point [33][34][35]. Northern Sweden has a positive loss coefficient and therefore must pay the energy fee to SvK, while for Southern Sweden, the loss coefficient is negative. A producer in southern Sweden will thus receive a payment for electricity input to the grid, as previously stated [33][34].
2.8 Hydrogen Production
Production of hydrogen can take place through various methods. These methods are, for example, water electrolysis, biomass or coal gasification, and hydrocarbon reformation (e.g., steam methane reforming, SMR). Currently, the most common practiced method is SMR due to generating 95% of world’s hydrogen [36], while water electrolysis only produces 4% [37]. However, SMR is based on fossil fuels, which makes this method a non-renewable production pathway, and therefore not sustainable in the long run. Generation of hydrogen by water electrolysis powered by renewable energy, is on the other hand sustainable and environmentally friendly in terms of reducing carbon emissions and uses an in practical terms unlimited feedstock (renewable energy and water). A summary of the conventional production methods’ advantages, drawbacks, and production cost are presented in Table 6.
The most common and commercially available electrolyzers are the alkaline water electrolyzers (AWE) and proton exchange membrane (PEM) electrolyzers [38], where AWE is the most mature and cheapest technology [39]. The Solid Oxide Electrolyzer (SOEC) is another type of waterelectrolyzer with a potential of becoming more affordable than AWE [40], while also possess desirable properties such as a drastic reduction in power consumption [41]. However, due to it still being in the development phase, it will not be reviewed in this thesis.
26

Table 6. Conventional hydrogen production methods and the respective advantages, disadvantages, and hydrogen production cost [14][15].
Production Method |
Cost |
Advantages |
Disadvantages |
|
|
|
|
|
|
|
|
|
|
|
Steam Reforming |
1.5–2.27 [€/kg] |
Mature technology. |
Produces CO, CO2. |
|
|
|
|
infrastructure available. |
|
Coal Gasification |
1.77–2.05 |
[€/kg] |
Cheap feedstock. |
Feedstock impurities. |
Partial Oxidation |
1.48 |
[€/kg] |
Established technology. |
Produces heavy oil and |
|
|
|
|
petroleum coke. |
|
|
|
|
|
2.8.1 Hydrogen Production by Water Electrolyzers
Water-electrolysis is a hydrogen production technology that uses an electrochemical process to generate highly pure hydrogen (99.99%) with zero-carbon emissions. This process involves dissociating pre-purified water into hydrogen gas (H2) and oxygen gas (O2), by using direct current (DC). Water electrolyzer produces zero-carbon emissions since oxygen and heat are the sole byproducts. A basic and general description of the reaction process taking place in a water electrolyzer is shown in equation (1) [15]:
1H O + Electricity (237.2 |
kJ |
) → H |
|
+ |
1 |
O |
|
+ Heat (48.6 |
kJ |
) |
(1) |
mol |
2 |
|
2 |
mol |
|||||||
2 |
|
|
2 |
|
|
|
|||||
All water-electrolysis technologies consist of three main components: anode, cathode and an electrolyte containing charge carriers. However, these technologies can be separated and categorized into different groups based on operating conditions, type of electrolyte, electrodes and membranes, and ionic agents (OH-, H+, O2-) [15].
The investment cost of water-electrolysis varies depending on its technology and the year it was produced, as shown in Table 7. AWE compared to PEM, is cheaper due to having a wellestablished technology and it does not contain noble electro catalysts, making it more affordable to purchase. The SOEC´s, still in development phase, capital cost is an estimate. In this thesis, the only commercially available electrolyzers (PEM and AWE) will be viewed.
Table 7. Investment costs (CAPEX) for electrolyzers in year 2020 [42].
Electrolyzer Type |
Scenario |
CAPEX |
|
|
|
|
|
|
PEM |
Lowest |
0.385 [m€/kW] |
PEM |
Medium |
1.182 [m€/kW] |
PEM |
Highest |
2.068 [m€/kW] |
|
|
|
|
|
|
AWE |
Lowest |
0.571 [m€/kW] |
AWE |
Medium |
0.988 [m€/kW] |
AWE |
Highest |
1.268 [m€/kW] |
|
|
|
|
27 |
|

SOEC |
Lowest |
0.677 [m€/kW] |
SOEC |
Medium |
1.346 [m€/kW] |
SOEC |
Highest |
2.285 [m€/kW] |
|
|
|
However, despite the advantages of water-electrolysis, it has couples of disadvantages, such as, high electricity consumption, high capital costs, and low hydrogen evolution rate; which is the rate of hydrogen production by water electrolysis. This explains why this technology is not yet dominating the market for hydrogen production technologies. Therefore, researchers aim to enhance the electrolyzer’s efficiency to reduce the specific power consumption and to develop alternative low-cost components, such as cheaper materials for cathodes and anodes [15].
2.8.1.1 Alkaline Water Electrolyzer
The alkaline water electrolyzer (AWE) was firstly introduced in 1789, making it the oldest and most mature water-electrolyser [15]. It is commercially available in capacities in the range of megawatts with an energy efficiency of 70–80% (from electricity to energy content of the produced hydrogen), and it is available for industrial applications. The technology of AWE is the most well-developed of all electrolyzers due to its maturity. It possesses favourable properties, such as, excellent reliability, durability, and security. Additionally, AWE is less expensive than PEM as seen in Table 7, and this is for example due to using porous nickel-based electrodes instead of noble electro catalysts. However, AWE’s disadvantages are slow dynamic operation, low current density (>400 mA/cm2), low operational pressure (3–30 bar), and the overall performance degradation over time due to formation of carbonates on the cathode electrode [15][43][44].
AWE operates at a temperature of approximately 30–80 and its electrolyte is alkaline based, commonly a mixture of purified water with an alkaline solution of 30% wt of potassium hydroxide (KOH) or 25% of sodium hydroxide (NaOH). The principles of AWE involve immersing the two metallic electrodes into the electrolyte, which are separated from one another by a membrane or a diaphragm. These electrodes are connected to an external power source in order to supply current (current density of 2000–4000 A/m2) to the cell. At first, the water molecules will split once in contact with the cathode’s surface under the influence of the applied current, to produce H2(g) and OH- as seen in reaction (2). Thereafter, the generated H2(g) is lead out of the system while the hydroxide ions will travel to the anode by passing the porous membrane, which is centrally positioned in the cell. At the anode, water and oxygen are produced once the hydroxide ions are discharged of its electrons according to reaction (3) [15][43][44]. The overall cell reaction is expressed in reaction (4), and a schematic illustration of an AWE is available in Figure 10.
Cathode: 2H O + 2e− |
→ H + 2OH− |
(2) |
||||||||
|
2 |
1 |
|
|
|
|
|
2 |
|
|
Anode: |
2OH− → |
|
O |
+ H O + 2e− |
(3) |
|||||
|
||||||||||
|
2 |
|
2 |
|
|
2 |
|
|||
|
|
|
1 |
|
|
|||||
Overall: |
H O → H |
|
+ |
O |
(4) |
|||||
2 |
|
|
||||||||
|
2 |
|
|
|
2 |
2 |
|
|||
|
|
|
|
|
|
|
|
|||
28