

книги / How to Write a Research Paper in English
..pdfThen the normalized matrix would be
Step 3: Evaluate the Positive Ideal Solution (PIS)  and Negative Ideal Solution (NIS) by the Equations 2a and 2b;
′ |
(2a) |
′ |
(2b) |
Where is a set of benefit attribute whereas ′ is a set of cost attribute.
Step 4: Compute distance between |
target ideal solution to PIS ( |
|
and target ideal to NIS ( by |
Equation 3a and 3b; |
|||
|
|
|
(3a) |
|
|
|
(3b) |
Step 5: Calculate the Relative Closeness Coefficient ( ) for each alternative from the ideal solution from Equation 4. Higher the closeness coefficient, better is the material sustainability.
(4)
3. Results and Discussion
The study used the TOPSIS approach to the decision problem of selecting the best binder material alternative considering nine parameters. The findings of the study optimized the positive attributes and minimized negative attributes.The study considered a fresh property like Workability (W), hardened mechanical properties like Compressive Strength (CS) with respect to the age of curing for 28, 56 and 90 days, Split tensile (SS) Flexural Strength (FS), durability properties like Sorptivity (SR), RCPT and LCC. In the present study, the prevailing rates of material, labor and transportation,and manufacturing in South India have been considered. The Tables (1 – 6) illustrate the results of the TOPSIS method. The results obtained from experimental investigation for nine properties of the concrete made of different SCM’s is considered has a decision matrix and are shown in Table 1. Based on the step by step approach described in section 4 the decision problem has been resolved for selecting a best binder material alternative.
Step 1: Formulate the decision matrix considering attributes and alternative. The present study considered nine attributes and five alternatives (Table 1).
61

Table 1. Decision Matrix for attributes and alternatives
Attributes
|
|
C1 |
C2 |
C3 |
C4 |
C5 |
C6 |
C7 |
|
C8 |
C9 |
||
|
|
|
|
|
|
|
|
SR |
|
|
|
|
|
|
|
W |
CS (MPa) |
|
SS |
FS |
|
RCPT |
LCC |
||||
|
|
(mm) |
|
|
|
(Moa) |
(MPa) |
(mm/min) (Cou- |
(Rs/cum) |
||||
|
|
|
28 |
56 |
90 |
28 |
28 |
|
|
|
lombs) |
|
|
|
|
|
Days |
Days |
Days |
Days |
Days |
|
|
|
|
|
|
|
|
|
|
|
|
|
|
|
0.458 |
|
|
|
|
A1 |
97 |
25.20 |
30.08 |
31.39 |
2.15 |
5.96 |
|
2100 |
9650 |
|
|||
A2 |
100 |
28.34 |
30.52 |
31.16 |
2.08 |
4.81 |
|
0.342 |
1248 |
8350 |
|
||
A3 |
90 |
27.23 |
34.88 |
37.49 |
2.56 |
5.92 |
|
0.468 |
1648 |
8950 |
|
||
A4 |
85 |
26.16 |
32.70 |
35.06 |
1.52 |
4.82 |
|
0.621 |
1356 |
9129 |
|
||
A5 |
92 |
28.34 |
30.08 |
34.88 |
2.49 |
6.41 |
|
0.547 |
1895 |
8432 |
|
||
A1-Ordinary Portland Cement (OPC), A2- Pozzolona Portland Cement Flyash based (PPC- F), A3- Pozzolona Portland Cement Slag based (PPC-S), A4- Metakaolin (M), A5- Composite Cement (CC).
Step 2: Normalizing the decision matrix to a non-dimensional unit matrix. The normalization technique is carried out using Equation 1 and represented in Table 2.
Table 2. Normalized Decision Matrix
|
C1 |
C2 |
C3 |
C4 |
C5 |
|
C6 |
C7 |
C8 |
C9 |
A1 |
0.47 |
0.42 |
0.42 |
0.41 |
0.44 |
0.47 |
0.41 |
0.58 |
0.48 |
|
A2 |
0.48 |
0.47 |
0.43 |
0.41 |
0.42 |
0.38 |
0.31 |
0.33 |
0.42 |
|
A3 |
0.43 |
0.45 |
0.49 |
0.49 |
0.52 |
0.47 |
0.42 |
0.43 |
0.45 |
|
A4 |
0.41 |
0.43 |
0.46 |
0.46 |
0.31 |
0.38 |
0.56 |
0.36 |
0.46 |
|
A5 |
0.44 |
0.47 |
0.42 |
0.46 |
0.51 |
0.51 |
0.49 |
0.50 |
0.42 |
|
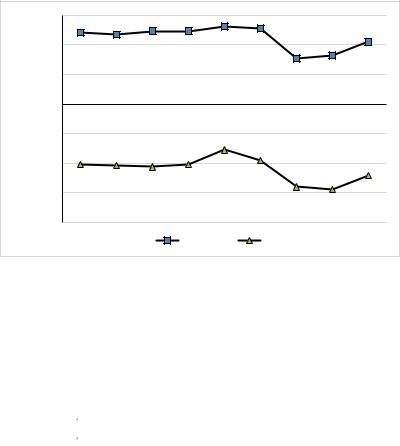
Step 3: The Positive Ideal Solution (PIS) and Negative Ideal Solution (NIS) is evaluated using the Equations (2a and
2b) and are represented in Figure 2. The study observed that the attributes W, CS, SS and FS are to be maximized (beneficial attributes) and SR, RCPT, and LCC are minimized (cost attributes).
62
Dis |
0.60 |
|
|
|
|
|
|
|
|
ta |
|
|
|
|
|
|
|
|
|
nc |
0.40 |
|
|
|
|
|
|
|
|
e |
|
|
|
|
|
|
|
|
|
fro |
0.20 |
|
|
|
|
|
|
|
|
m |
0.00 |
|
|
|
|
|
|
|
|
ide |
|
|
|
|
|
|
|
|
|
al |
C1 |
C2 |
C3 |
C4 |
C5 |
C6 |
C7 |
C8 |
C9 |
sol |
0.20 |
|
|
|
|
|
|
|
|
uti |
0.40 |
|
|
|
|
|
|
|
|
on |
|
|
|
|
|
|
|
|
|
|
0.60 |
|
|
|
|
|
|
|
|
|
0.80 |
|
|
|
|
|
|
|
|
|
|
|
|
PIS |
|
NIS |
|
|
|
Figure 2. Positive and Negative Ideal Solution with respect to attributes
Step 4: Computethe distance between the target ideal solution to PIS ( |
|
and target ideal to NIS ( |
|
by Equation (3a and 3b) as shown in Table 3. |
|
Table 3. Distance to PIS and NIS from Ideal Solution is computed using Equations 3a and 3b
|
|
A1 |
A2 |
A3 |
A4 |
A5 |
|
|
|
|
|
|
|
|
|
0.31 |
0.19 |
0.17 |
0.37 |
0.27 |
|
||||||
|
0.22 |
0.39 |
0.33 |
0.23 |
0.28 |
|
|
||||||
|
||||||
|
|
|
|
|
|
|
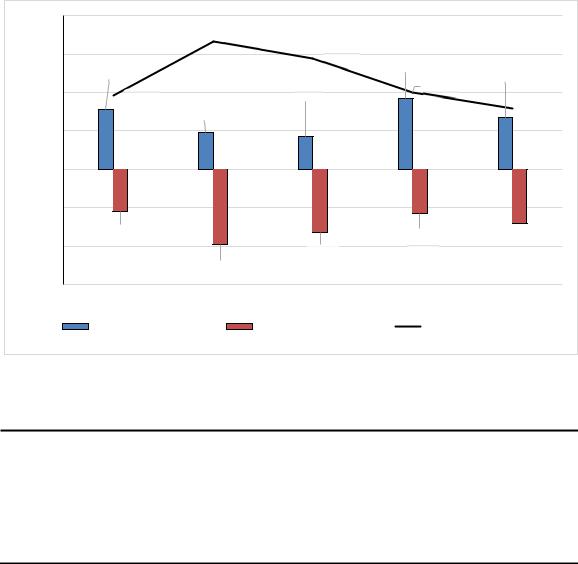
Step 5: Compute the Closeness Coefficient of each alternative with respect to PIS and NIS using Equation 4 and the findings are represented in Table 4. Higher the Closeness Coefficient (CC) better is the material performance. The findings of the study reveal that the positive and negative values for each attribute will either be converging or diverging towards the ideal solution line (auxiliary zero line) (Figure 2). For example, the criteria Compressive Strength (CS) should be maximized, which is a positive aspect for any alternative, and negatively it should be minimized. Similarly, criteria sorptivity (C7) should be minimized, which is a positive aspect for any alternative and negatively it should be maximized. In the case of criteria C7, the positive and negative values are diverging and for criteria CS, it is observed to be converging towards the ideal solution. The ideal solution (Alternative) is selected based on criteria nearest distance to Positive Ideal Solution (PIS) and farthest Negative Ideal Solution (NIS). Considering equal importance to criteria, from Figure 3, it can be observed that the material alternative (A2) PPC flyash based (PPC-F) is having nearest PIS and farthest NIS. The order of preference for selecting the sustainable binder material alternative based on CC values and is found to be A2 > A3 > A5 > A1 > A4 (Table 4).
63
|
0.8 |
|
|
|
|
|
Dis |
|
0.665 |
|
|
|
|
tan |
0.6 |
|
|
|
|
|
|
0.576 |
0.37 |
|
|
||
ce |
|
0.31 |
|
0.27 |
||
|
|
|
||||
fro |
|
|
|
0.402 |
||
0.4 |
|
0.17 |
|
|
||
m |
0.384 |
|
|
|||
|
|
0.319 |
||||
ide |
|
0.19 |
|
|
|
|
al |
0.2 |
|
|
|
|
|
sol |
|
|
|
|
|
|
uti |
0.0 |
|
|
|
|
|
on |
|
|
|
|
|
|
|
0.2 |
|
|
|
|
|
|
0.4 |
0.22 |
|
0.23 |
0.28 |
|
|
|
|
|
|||
|
|
0.33 |
|
|
|
|
|
|
0.39 |
|
|
|
|
|
0.6 |
|
|
|
|
|
|
|
Material alternatives |
|
|
|
|
|
|
|
|
|
|
|
|
|
Positive ideal Solution |
Negative Ideal Solution |
|
Closeness Coefficient |
|
Figure 3. Closeness coefficient and distance from ideal solution for binder alternatives
Table 4. Closeness Coefficient and Prioritizing of Material Alternative
|
OPC |
PPCFly PPC- |
Metakaolin |
Composite |
||
Alternative |
ash (A2) |
GGBS |
||||
(A1) |
(A4) |
Cement (A5) |
||||
|
|
(A3) |
||||
|
|
|
|
|
||
Closeness |
0.42 |
0.67 |
0.66 |
0.38 |
0.51 |
|
Coefficient |
|
|
|
|
|
|
Ranking |
4 |
1 |
2 |
5 |
3 |
|
4. Conclusions
The present study explored the use of decision-making method TOPSIS in selecting the best sustainable alternative considering quantitative attribute (Technological aspect).
The study has considered nine quantitative attributes, fresh propertyWorkability, hardened propertyCompressive Strength (28, 56 and 90days), Split tensile and Flexural Strength, durability property - Sorptivity, RCPT and Life Cycle Cost (LCC) in prioritizing the best sustainable material alternative.The following conclusions were drawn for selection of the best sustainable alternative.
•The study has considered nine quantitative attributes i.e., Workability, Strength (28, 56, 90) days, split tensile, Flexural strength, Sorptivity, RCPT and Lifecycle cost for selecting the best alternative.
•Amongst five SCM’s, flyash based PPC is prioritized with the highest closeness coefficient of 0.67 whereas Metakaolin has achieved the leastvalue of 0.38.
•The order of priority for selection of sustainable binder material alternative is found to be Flyash based PPC, Slag based PPC, Composite cement, OPC and Metakaolin.
•The approach explored in the study will facilitate the designers to take decisions in selecting the best sustainable material among a pool of available alternatives
64
5. Acknowledgements
The authors would sincerely like to thank the management of Kakatiya Institute of Technology (KITSWAutonomous), Warangal, Telangana, Warangal for providing the testing facilities and their constant support.
6. Conflicts of Interest
The authors declare no conflict of interest.
7.References
[1]Franco, Sainu, Venkata Ravibabu Mandla, and K. Ram Mohan Rao. “Urbanization, Energy Consumption and Emissions in the Indian Context A Review.” Renewable and Sustainable Energy Reviews 71 (May 2017): 898–907. doi:10.1016/j.rser.2016.12.117.
[2]Reddy A. S, Rathish Kumar P, Anand Raj P, Sustainable performance indicators in built environment for developing countries. Bloomsbury Publishing India Pvt Ltd., 2018.
[3] Miller, Sabbie A, Arpad Horvath, Paulo J M Monteiro, and Claudia P Ostertag. “Greenhouse Gas Emissions from Concrete Can Be Reduced by Using Mix Proportions, Geometric Aspects, and Age as Design Factors.” Environmental Research Letters 10, no. 11 (November 1, 2015): 114017. doi:10.1088/1748-9326/10/11/114017.
[4]Ding, Grace K.C. “Sustainable construction—The Role of Environmental Assessment Tools.” Journal of Environmental Management 86, no. 3 (February 2008): 451–464. doi:10.1016/j.jenvman.2006.12.025.
[5]Al-Jebouri, Muhannad F.A., Mohamed S. Saleh, Sudharshan N. Raman, Riza Atiq Abdullah Bin O.K. Rahmat, and Awni K. Shaaban. “Toward a National Sustainable Building Assessment System in Oman: Assessment Categories and Their Performance Indicators.” Sustainable Cities and Society 31 (May 2017): 122–135. doi:10.1016/j.scs.2017.02.014.
[6]Alexander, Mark, Alexandra Bertron, and Nele De Belie, eds. “Performance of Cement-Based Materials in Aggressive Aqueous Environments.” RILEM State-of-the-Art Reports (2013). doi:10.1007/978-94-007-5413-3.
[7] Kaivo-oja, Jari, Juha Panula-Ontto, Jarmo Vehmas, and Jyrki Luukkanen. “Relationships of the Dimensions of Sustainability as Measured by the Sustainable Society Index Framework.” International Journal of Sustainable Development & World Ecology 21, no. 1 (November 21, 2013): 39–45. doi:10.1080/13504509.2013.860056.
[8]Ubarte, Ieva, and Oleg Kaplinski. “REVIEW OF THE SUSTAINABLE BUILT ENVIRONMENT IN 1998–2015.” Engineering Structures and Technologies 8, no. 2 (July 7, 2016): 41–51. doi:10.3846/2029882x.2016.1189363.
[9]Zhong, Yun, and Peng Wu. “Economic Sustainability, Environmental Sustainability and Constructability Indicators Related to Concreteand Steel-Projects.” Journal of Cleaner Production 108 (December 2015): 748–756. doi:10.1016/j.jclepro.2015.05.095.
65
[10]Florez, Laura, and Daniel Castro-Lacouture. “Optimization Model for Sustainable Materials Selection Using Objective and Subjective Factors.” Materials & Design 46 (April 2013): 310–321. doi:10.1016/j.matdes.2012.10.013.
[11]Chen, Chen-Tung, Ching-Torng Lin, and Sue-Fn Huang. “A Fuzzy Approach for Supplier Evaluation and Selection in Supply Chain Management.” International Journal of Production Economics 102, no. 2 (August 2006): 289–301. doi:10.1016/j.ijpe.2005.03.009.
[12]Gursel, Aysegul Petek, Helena Maryman, and Claudia Ostertag. “A Life-Cycle Approach to
Environmental, Mechanical, and Durability Properties of ‘green’ Concrete Mixes with Rice Husk Ash.” Journal of Cleaner Production 112 (January 2016): 823– 836. doi:10.1016/j.jclepro.2015.06.029.
[13][13] Reddy, A. Suchith, P. Anand Raj, and P. Rathish Kumar. “Developing a Sustainable Building Assessment Tool (SBAT) for Developing Countries—Case of India.” Urbanization Challenges in Emerging Economies (December 13, 2018). doi:10.1061/9780784482032.015.
[14]Reddy, A. Suchith, P. Rathish Kumar, and P. Anand Raj. “Preference Based Multi-Criteria Framework for Developing a Sustainable Material Performance Index (SMPI).” International Journal of Sustainable Engineering 12, no. 6 (March 7, 2019): 390–403. doi:10.1080/19397038.2019.1581853.
[15]Kurda, Rawaz, Jorge de Brito, and José D. Silvestre. “CONCRETop Method: Optimization of Concrete with Various Incorporation Ratios of Fly Ash and Recycled Aggregates in Terms of Quality Performance and Life-Cycle Cost and Environmental Impacts.” Journal of Cleaner Production 226 (July 2019): 642–657. doi:10.1016/j.jclepro.2019.04.070.
[16]Ganjian, Eshmaiel, Nader Ghafoori, and Peter Claisse. “Sustainable Construction Materials and Technologies.” Journal of Materials in Civil Engineering 31, no. 7 (July 2019): 02019001. doi:10.1061/(asce)mt.1943-5533.0002745.
[17]Kiani, Behnam, Robert Y. Liang, and Jacob Gross. “Material Selection for Repair of Structural Concrete Using VIKOR Method.” Case Studies in Construction Materials 8 (June 2018): 489–497. doi:10.1016/j.cscm.2018.03.008.
[18]Antoniou, Fani, and Georgios Aretoulis. “A Multi-Criteria Decision-Making Support System for Choice of Method of Compensation for Highway Construction Contractors in Greece.” International Journal of Construction Management 19, no. 6 (March 26, 2018): 492–508. doi:10.1080/15623599.2018.1452103.
[19]Reddy, A. Suchith, P. Rathish Kumar, and P. Anand Raj. "Developing a Material Sustainable Performance Score (MSPS) to select an alternative Cementitious Material." Cement Wapno Beton 24, no. 1 (2019): 68-79.
[20]Mahmoudkelaye, Samira, Katayoon Taghizade Azari, Mitra Pourvaziri, and Elnaz Asadian. “Sustainable Material Selection for Building Enclosure through ANP Method.” Case Studies in Construction Materials 9 (December 2018): e00200. doi:10.1016/j.cscm.2018.e00200.
66
[21]Sun, Chia-Chi. “A Performance Evaluation Model by Integrating Fuzzy AHP and Fuzzy TOPSIS Methods.” Expert Systems with Applications 37, no. 12 (December 2010): 7745–7754. doi:10.1016/j.eswa.2010.04.066.
[22]Tian, Guangdong, Honghao Zhang, Yixiong Feng, Danqi Wang, Yong Peng, and Hongfei Jia. “Green Decoration Materials Selection Under Interior Environment Characteristics: A Grey-Cor- relation Based Hybrid MCDM Method.” Renewable and Sustainable Energy Reviews 81 (January 2018): 682–692. doi:10.1016/j.rser.2017.08.050.
[23]Kaya, İhsan, and Cengiz Kahraman. “A Comparison of Fuzzy Multicriteria Decision Making Methods for Intelligent Building Assessment.” Journal of Civil Engineering and Management 20, no. 1 (March 10, 2014): 59–69. doi:10.3846/13923730.2013.801906.
67

Sample 2
American Journalof Civil Engineering
2019; 7(4): 108 112 http://www.sciencepublishinggroup.com/j/ajce doi: 10.11648/j.ajce.20190704.14
ISSN: 2330 8729 (Print); ISSN: 2330 8737 (Online)
Analysis on Influencing Factors of Blasting Vibration Caused by Shallow Tunnel Excavation
Haixia Wei1, Zheng Qu1, Jie Zhu1, 2, Qiangqiang Zhang1, 2
1School of Civil Engineering, Henan Polytechnic University, Jiaozuo, China 2School of Civil Engineering, Central South University, Changsha, China
Email address:
*Corresponding author
To cite this article:
Haixia Wei, Zheng Qu, Jie Zhu, Qiangqiang Zhang. Analysis on Influencing Factors of Blasting Vibration Caused by Shallow Tunnel Excavation. American Journal of Civil Engineering. Vol. 7, No. 4, 2019, pp. 108-112. doi: 10.11648/j.ajce.20190704.14
Received: September 8, 2019; Accepted: October 17, 2019; Published: October 23, 2019
Abstract: With the widespread construction of urban subway, more and more shallow tunnels will be constructed by blasting, and the problem of blasting vibration will become more prominent. Because of the randomness and variability of blasting source and topographic and geological factors, the propagation mechanism and influencing factors of blasting vibration wave are very complex. Based on blasting-vibration sample data obtained from the established numerical model of blasting excavation in shallow tunnel, the relational degree analysis was carried out for influencing factors of blasting vibration caused by shallow tunnel excavation with method of grey relational analysis. The results of the study are as follows: Among the four related factors, there is no optimal factor, and the maximum charge of one section is the quasi-optimal factor; The charge of the first section is the main factor affecting the peak particle velocity of blasting vibration; The maximum charge of one section is the main factor affecting the main frequency of blasting vibration; The delay interval is the main factor affecting the duration of blasting vibration. Furthermore, the measures to control blasting vibration caused by shallow tunnel excavation were put forward, such as reducing the charge of the first section, reducing the maximum charge of one section and rationally setting up the delay interval. The study has important guiding significance for safe blasting construction in shallow tunnel and scientific control of blasting vibration effect.
Keywords: Shallow Tunnel, Method of Grey Relational Analysis, Blasting Vibration, Influencing Factors, Control Measures
68
1. Introduction
The subway has been opened in 33 cities in China up to now. In the large-scale development of urban-subway construction, it is inevitable that more and more shallow tunnels will be constructed through the urban areas with many buildings on them. As the most economical and effective excavation method of rock mass engineering, borehole blasting is also the main construction method of rock tunnels. Compared with other blasting projects, the ground surface often has high blasting vibration intensity because of close distance from the blasting source in the blasting construction in shallow tunnels. Blasting vibration caused by underground excavation has become a hot and difficult research topic in the field of blasting engineering in recent years [1-7]. Because of the randomness and variability of blasting source and topographic and geological factors, the generation and propagation mechanism of blasting vibration wave is very complex. Although a lot of research has been done on the influence factors of blasting vibration and the characteristics of blasting vibration wave [8-13], there are still some problems that have not been fundamentally solved.
Based on blasting-vibration sample data obtained from the established numerical model of blasting excavation in shallow tunnel, the relational degree analysis was carried out for influencing factors of blasting vibration caused by shallow tunnel excavation with method of grey relational analysis. Furthermore, the measures to control blasting vibration caused by shallow tunnel excavation were put forward. The study has important guiding significance for safe blasting construction in shallow tunnel and scientific control of blasting vibration effect.
2. Principle of Method of Grey Relational Analysis
Method of grey relational analysis is a method to measure the degree of relation among factors according to the similarity or difference of the development trend of factors [14-16]. Method of grey relational analysis has been widely used in industry, agriculture, military, economy, ecology and other fields because of the ability to deal with the grey system with incomplete information, which has relatively high accuracy in the evaluating irregular indicators with small samples.
The specific calculation steps of method of grey relational analysis are as follows [17]: Step 1: Determine the analysis sequence.
The reference sequence reflecting the behavior characteristics of the system and the comparison sequence affecting the behavior characteristics of the system are determined.
Let the reference sequence Y ={Y k( ) |k =1,2, ,n}, the comparison sequence Xi ={Xi ( )k |k =1,2, ,n}, where i=1, 2, …, m.
Step 2: Make variables dimensionless.
The data in each factor sequence in the system may be different in dimension, and it is not convenient to compare or it is difficult to get the correct conclusion in comparison. Therefore, the dimensionless processing of data is generally required in the analysis of grey relational degree.
xi ( )k = |
|
Xi (k) ,k =12, , ,n;i =012, , , ,m (1) Xi ( )l |
|
Step 3: Calculate the relational coefficient.
The relational coefficient of x0(k) and xi(k):
minmin y k( )−x ki ( ) +ρmaxmax y k( )−x ki ( )
ξi ( )k = i k |
i k |
|
(2) |
|
y k( )−x ki ( ) +ρmaxmax y k( )−x ki ( )
i k
69

Let i ( )k =| y k( ) −x ki ( ) | , then
minmin i ( )k +ρmaxmax i ( )k
ξi ( )k = i k |
i k |
|
(3) |
|
|||
i |
k |
i ( )k +ρmaxmax i ( )k |
|
|
|
||
where ρ is the resolution coefficient, ρ ∞(0, ) . The smallerρis, the greater the resolution is. The general range of ρ is (0,1). Whenρ≤ 0.5463, the resolution is the best, usuallyρ= 0.5 .
Step 4: Calculate the relational degree.
Because the relational coefficient is the value of the relational degree between the comparison sequence and the reference sequence at each time, it has more than one number, and the information is too scattered to make overall comparison conveniently. It is necessary to concentrate the relational coefficient at each time into one value, that is, to find its average value as a quantitative expression of the relational degree between the comparison sequence and the reference sequence.
The formula of ri is as follows:
1 n |
|
ri = ∑ξi ( )k ,k =1,2, ,n |
(4) n k=1 |
Step 4: Rank the relational degree.
The relational degree is sorted by size. If r1 < r2, the reference sequence y is more similar to the comparison sequence x2.
After calculating the relational coefficient between sequence Xi(k) and Y(k), the average value of relational coefficients is calculated. The average ri is called the relational degree between Y(k) and
Xi(k).
3.Analysis on Influencing Factors of Blasting Vibration Caused by Shallow Tunnel Excavation
3.1. Determination of System Characteristic Variables and Related Factor Variables
The three main factors of blasting vibration, i.e. particle peak velocity, main frequency and duration, are often taken as the indexes to measure the damage degree of blasting vibration. Because the sample data in this paper are taken from numerical simulation experiments, the average combined velocity and velocity attenuation ratio in a given period of time are selected to represent the duration of blasting vibration in order to shorten the running time of the
computer. When analyzing blasting vibration caused by shallow tunnel excavation with method of grey relational analysis, particle peak velocity, main frequency, average combined velocity and velocity attenuation rate were selected as system characteristic variables, and were recorded as Y1, Y2, Y3 and Y4 respectively.
There are many factors affecting blasting vibration, including total charge, maximum charge of one section, maximum charge in cut section, minimum delay interval, number of sections, distance from blasting centers, number of free surfaces, hole network parameters, geological conditions, etc. The vibration effect produced by cutting blasting in shallow tunnel is the most obvious in practical engineering. Therefore, the excavation process of cutting blasting was simulated by numerical simulation test. Regardless of the factors that can not be quantitatively described, under the condition of constant distance from blasting centers and total charge, the four factors of charge of the first section, maximum
70