

93
.pdfPavlichenko L.M. et al.
however, through them from the east side (towards the Ilek River) the drains constantly oozed out, forming wide hollows inaccessible for the passage of transport.
Thus, the historical character and scale of groundwater pollution processes, the danger of turning the Aktobe reservoir into a new source of pollution Ilek infiltration water intakes and the transboundaryIlekRiverbyboronelement,theneed to reduce the environmental risk to public health and environmental objects cause groundwater to be acute and topical. This is confirmed by the inclusion of this problem in the Register of Environmental Problems of the Republic of Kazakhstan in the period 2008-2010.
The purpose of research – to determine the recovery value of the maximum ecological capacity Ilek River in the post area Alga 2, i.e., establish a period of natural self-cleaning Ilek River to the 0.5 mg/dm3 concentration, according to the equation of boron concentration trend for the period 1997-2018 yy.Toachievethisgoalitwasnecessarytosolvethe following tasks: to identify the thinning-out zones of boron polluted groundwater in the Ilek River and determine the amount of boron entering the River in these zones; to carry out calculations of the mass taken out of the boron pond; to assess the processes of self-purification of the river, which based on the regression model of dilution of boron concentration in Ilek River, when the groundwater is wedging out by the waters of the river, calculate, in accordance with the obtained trends, the period of achievement in the observation sections of the MPC value for boron.
Baseline data and research methods
The fact of contamination of groundwater with boron was first discovered in 1972. The boron elementwasdiscoverednotonlyinindustrialoutlets, but also in alluvium waters, in the Ilek river, and also in groundwater throughout the valley from the city of Alga to the borders of the Orenburg region, i.e. over 100 km.
The main areas of previous work were the study of pollution of soil and snow cover in an area covering the Alga Chemical Factory industrial site and the Alga region. The main research methods were abbreviated chemical analysis of water and semi-quantitative spectral analysis of soil samples and the dry residue of water samples. The zone of high soil pollution in the forest (3000 mg/kg/MPC) is local and is confined directly to the workshop for its production.
Unfortunately, the special study of the material composition of sludge in storage collectors was not givenattentionuntil2008,andgroundwaterpollution processes under their influence were studied only until 2005, when groundwater monitoring was conducted in the Ilek River valley on the Alga region.Afterthefundingendingin2005,monitoring observations at the site have stopped.
A detailed study of bottom sediments of the Aktobe reservoir in 1992 revealed that the boron content in aqueous extracts from silts is 0.1-0.5 mg/100 g, fluorine: 0.3-1.6 mg/100 g. These studies have established the ability of silts to sorb boron, as wellasitshighmobility,whenanymechanicaleffect led to the boron returned to its dissolved state. As a recommendation, the authors of the stock materials proposed the elimination of the Aktobe reservoir at the initial stage of its filling, until it turned into a new powerful source of pollution [6].
Construction of the Aktobe reservoir (1988) on theIlekRiversouthofAktoberegion,contributedto the boron reduction in the surface water of the river at the release from the Aktobe reservoir. This was resulted in a decrease in its concentration in most observation wells at the Ilek infiltration water intake and in the production wells of this water intake.
At the same time, accumulation of boroncontaining sludge has occurred and still occurs in the Aktobe reservoir, forming an ever-increasing threat of re-disabling the infiltration water intakes of Aktobe city, located below the dam. This fact is confirmed by the rare cases of exceeding the maximum permissible concentration (MPC) along the boron below the dam after the releases, which create the conditions for turbulent mixing of water in the Aktobe reservoir.
It is worth noting that the conditions for the formation of runoff and the water regime of the rivers and temporary streams of the territory in question are formed under the influence of climatic factors, relief, soil and hydrogeological features. Themainclimaticfactorsdeterminingthesizeofthe annual river flow are snow reserves in the basins at the beginning of snowmelt, rainfall during the flood period, degree of wetting and depth of freezing of the groundwater catchments, intensity of snowmelt in the spring.
Rivers of the Ilek River Basin, according to the water regime conditions, belong to the Kazakhstan type with a pronounced predominance of runoff in the spring period. The spring flood passes in one wave at the end of March – the first half of April. After the end of the spring flood, summer-autumn low flow begins on the rivers. The runoff value
ISSN 1563-034Х |
Eurasian Journal of Ecology. №1 (58). 2019 |
41 |
еISSN 2617-7358 |
|
|

The ecological capacity assessment of the Ilek River with boron pollution
decreases sharply, and at many watercourses the runoff completely stops. The minimum summer expenses are observed in July-August, as a rule, they are higher than the minimum winter expenses. Winter runoff is insignificant compared to annual runoff.Thefreezingofriversisobservedthroughout the territory.
The river flow in the basin varies greatly from year to year. In wet years, the runoff value exceeds the perennial average several times, in low-water years it is characterized by extremely low runoff value. A distinctive feature of the long-term course of runoff is the large repeatability of years with low water content, often following one after another and forming low-water periods.
To study the pollution of groundwater, the thinning-out of which into the Ilek River leads to the pollution of the Aktobe reservoir, as well as the Ilek infiltration water intakes and the transboundary Ilek River below the dam, the first task is to identify groundwater seeping zones and determine the amount of boron entering these zones into the river.
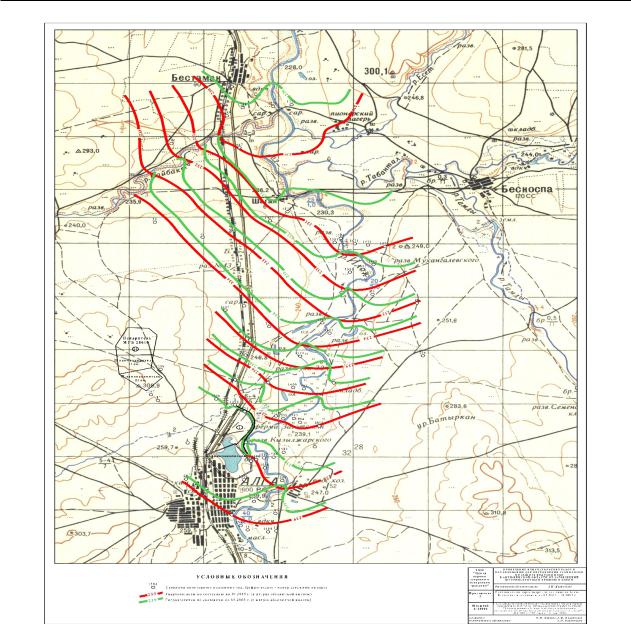
The thinning-out calculations [7, 8] were carried outonthebasisofamapofhydroisohypsum(Figure 2) taking into account the filtration characteristics of the Quaternary sediments of the Ilek River and hydrogeological map with isolines of boron concentrations presented in the pre-papers [9].
To simplify the calculations, the flow rate of the natural groundwater flow per 1 m of the flow width was determined:
Q = K Lm I , |
(1) |
Now, in order to determine the expenses of the thinning-out groundwater, in each zone of the thinning-out, it will be necessary to establish only the length of the thinning-out zone.
Thecalculationofthemasstakenoutoftheboron pond is based on an estimate of the volume V of boron contaminated groundwater and the weighted average the boron concentration C in them:
m = CV , |
(2) |
wherem–isthemassofboroncarriedbytheflowof groundwater from the sludge collector.
Themainproblemofestimatingthemassofboron in the thinning-out flow of polluted groundwater is the reliable determination of the geometric parameters of the halo pollution of groundwater – the averaged length of the “tongue” of boron spread with groundwater flow L and width B.
These data were taken from a hydrogeological map, which showed in the pre-papers. Taking into account these flow parameters of boron migration with groundwater, and according to the geometric, filtration, capacitive and migratory parameters of the aquifer, from which we are interested in the average thickness of the aquifer H and the dynamic porosity p, we can calculate the volume of water contaminated with boron [10]:
V = LBH p |
(3) |
Evaluation of self-cleaning processes Ilek River based on regime observations of RSE “KazHydroMet” is based on regression models (trends of observation series) [11]. According to the description of the observational network in the InformationBulletinsontheStateoftheEnvironment in the Republic of Kazakhstan, the Center for Environmental Monitoring of the Environment of the Republic of Kazakhstan RSE “KazHydroMet” within the Aktobe region to the border with Russia has 5 observation points (Table 1).
The first three posts are located in the AlgaAktobe reservoir area, and the last of them can be taken as a post at the Aktobe reservoir, since it is 0.5 km above the city of Aktobe, i.e. below the dam. The first post is a background in relation to the old sludge collector, which is considered the main source of pollution of the river due to its close proximity. The second post is located 0.5 km below the village of Bestamak and 21 km below the old sludge collector. The distance from the village of Bestamak to the southern (opposite dam) boundary of the reservoir is 3.5 km from this village (5.15 km along the channel).
According to the information bulletins, Table 2 was compiled based on the registered cases of high pollution averaged over the year.
According to these data, graphs of changes in the concentration of boron were constructed over the years and the equations of trends (regression) were selected for each post. Gradients of natural self-purification were calculated in the time aspect for each observation point as the difference in concentration of a particular year and the previous one, and in a territorial aspect by the difference in concentrations for each year between different observation points.
The same data was used to plot graphs of boron concentrations in each observational system, and thentheregressionequationswereselectedforthese graphs in Excel.
42 |
Хабаршы. Экология сериясы. №1 (58). 2019 |
Pavlichenko L.M. et al.
Figure 2 – The map of Ilek River hydroisohypsum
Table 1 – Location of water posts on the Ilek River
№ |
Name of the water post |
Location |
|
|
|
1 |
Alga 1 |
1 km above sludge collector |
|
|
|
2 |
Alga 2 |
0.5 km below the groundwater outlet |
|
|
|
3 |
Aktobe 1 |
0,5 km above the city |
|
|
|
4 |
Aktobe 3 |
0,5 km below the mouth of the river Genishke |
|
|
|
5 |
Georgievka village |
0,5 km below the groundwater outlet |
|
|
|
ISSN 1563-034Х |
Eurasian Journal of Ecology. №1 (58). 2019 |
43 |
еISSN 2617-7358 |
|
|

The ecological capacity assessment of the Ilek River with boron pollution
Table 2 – The observations results of pollution of surface water with boron in the Alga-Aktobe region, in mg/dm3 for the period 1997-2018 yy.
№ |
Years |
|
Hydro posts |
|
|
Alga 1 |
Alga 2 |
Aktobe 1 |
|||
|
|
||||
1 |
1997 |
0,47 |
1,13 |
0,47 |
|
2 |
1998 |
0,34 |
1,02 |
0,43 |
|
|
|
|
|
|
|
3 |
2000 |
0,21 |
0,73 |
0,39 |
|
|
|
|
|
|
|
4 |
2001 |
0,2 |
0,49 |
0,34 |
|
|
|
|
|
|
|
5 |
2002 |
0,42 |
1,09 |
0,49 |
|
|
|
|
|
|
|
6 |
2003 |
0,23 |
0,96 |
0,81 |
|
7 |
2004 |
0,2 |
0,73 |
0,33 |
|
8 |
2005 |
0,2 |
0,64 |
0,3 |
|
9 |
2006 |
0,36 |
1,04 |
0,4 |
|
10 |
2007 |
0,35 |
0,72 |
0,37 |
|
11 |
2008 |
0,36 |
0,63 |
0,35 |
|
12 |
2009 |
0,37 |
0,64 |
0,46 |
|
13 |
2010 |
0,36 |
0,69 |
0,43 |
|
|
|
|
|
|
|
14 |
2011 |
0,21 |
0,53 |
0,36 |
|
|
|
|
|
|
|
15 |
2012 |
0,29 |
0,64 |
0,39 |
|
|
|
|
|
|
|
16 |
2013 |
0,26 |
0,44 |
0,28 |
|
17 |
2014 |
0,27 |
0,413 |
0,24 |
|
18 |
2015 |
0,33 |
0,48 |
0,18 |
|
19 |
2016 |
0,222 |
0,295 |
0,304 |
|
20 |
2017 |
0,237 |
0,699 |
0,190 |
|
21 |
2018 |
0,202 |
1,20 |
0,192 |
Ecological capacity of the Ilek River we understood in the traditional sense of [12, 13]: it is the ability of the natural environment to contain anthropogenic pressures, harmful chemical and other impacts to the extent that they do not lead to land degradation and the entire environment [14]. Since even according to regime observations, it can be seen that even when comparing with MPC for boron 2015 (the MPC value for fishery purposes was previously taken, which was 0.017 mg/dm3), the average annual concentrations almost reached the MPC, i.e. even in the background, the ecological capacity of the river was almost exhausted.
In the Alga 2 section, 21 km below the main source of pollution, the boron concentration for almost the entire observation period, presented in the sample (Table 2), exceeded the maximum allowable concentration of 2015 for boron, i.e. this section shows the excess of the ecological capacity of the river [15].
Thus,weshouldconsiderthetaskofdetermining the ecological capacity as the inverse – determining
the period when natural self-purification processes restore at least the maximum limits of the ecological capacity to 0.5 mg/dm3 at the Alga 2. This problem is solved using the regression equation for this alignment on the forecast part of it (after 2018).
Results and discussion
We will carry out calculations for all the above tasks: identify the thinning-out zones of boron polluted groundwater in the Ilek River and determine the amount of boron entering these zones; calculate the mass of boron removed from the pond. The next one is estimate the process of river self-purification based on the regression dilution model focused in boron concentration, when wedging out the groundwater by the waters of the Ilek River. In the end, we could calculate, in accordance with the obtained trends, the period of achievement in the observation sections of the MPC value for boron.
The magnitude and number of the thinning-out zones were determined from the water-dip map
44 |
Хабаршы. Экология сериясы. №1 (58). 2019 |

Pavlichenko L.M. et al.
based on taking into account the direction of the flow of groundwater as normals to these isolines. Careful analysis of the iso-gypsum allowed us to isolate the following thinning-out zones in this area. The first zone is located near the old sludge collector. It is very close to the river, the flow of polluted groundwater, thinningout in this zone, is directed perpendicular to the isohypse 238 and its length from the left shores was 1250 m. From the right shores in this zone, too, a thinning-out of about 400 m width occurs. This is an area of groundwater wedging out with the highest concentrations of boron in groundwater.
The second zone of thinning-out begins above the section VI-VI after 750 m, then has a gap and continues in the area where the Suyksu stream (temporary watercourse) flows another 1130 m. follows. Therefore, the second zone of pinching out of polluted groundwater on the left shore has a length of 1880 m.
The average thickness of the alluvial aquifer m in the Alga-Aktobe reservoir is about 15 m, the calculated value of the filtration coefficient K is taken to be 35 m/day, and the hydraulic gradient is I = 0.0015. According to the hydrogeological map of the Alga-Aktobe reservoir, it turns out that the averagelengthofthe“tongue”ofborondistributionwith groundwater flow L is about 10 km. The average width over several profiles of its B reaches 3.5 km.
Since the flow rate of the natural groundwater flow per 1 m of the flow width is equal in accordance with (1) is equal to:
Q = KLmI = 35×10000×15×0,0015=0,79 m3/day,
3 |
3 |
~ |
or Q = 0,79 m |
/day = 790 dm |
/day, or Q = 0,033 |
m3/h., knowing the size of the thinning-out zones, it is easy to calculate the volumes of the pinned-out groundwater and the mass of boron carried by them.
Forthefirstzone:Inthiszonecouldbethinningout from both shores, groundwater with concentrations of more than 100 mg/dm3. Thus, in this zone, taking into account the imperfection coefficient of the drain 0.3, thinning-out 391 m3/day, i.e per one day 39 g boron element is moved into the Ilek River, and for the low-flow period (~ 300 days) – about 12 kg of one year.
For the second zone: In this zone could be thin- ning-out 446 mg/dm3. Focusing on the boron concentrationinthewellNo1600(82.7mg/dm3),weget 37 g of boron per day, or 11 kg per year.
Based on the regime observations of RSE “KazHydroMet” (Table 2), the authors evaluated the self-purificationprocesses of the Ilek River.According to these data, charts were constructed and empirical curves of the dynamics of changes in boron concentrations were calculated for each post for the period 1997-2018 yy. (Table 3, Figure 3).
Table 3 – The results of observations of pollution of surface waters with boron on theAlga-Aktobe region, in mg/dm3 for the period 1997-2018 yy.
|
|
|
|
Gradients of self-purification of the Ilek River from boron |
||
№№ |
Years |
|
Time aspect, mg/dm3Ч |
|
Spatial aspect, mg/dm3∙ |
|
|
|
(distance between posts) |
||||
|
|
|
|
|
|
|
|
|
Alga 1 (background) |
|
Alga 2 |
Aktobe reservoir 1 |
Alga 1 –Alga 2 |
|
|
|
|
|
|
|
1 |
1997 |
|
|
|
|
-0,66 |
|
|
|
|
|
|
|
2 |
1998 |
0,13 |
|
0,11 |
0,04 |
-0,68 |
3 |
2000 |
0,13 |
|
0,29 |
0,04 |
-0,52 |
|
|
|
|
|
|
|
4 |
2001 |
0,01 |
|
0,24 |
0,05 |
-0,29 |
|
|
|
|
|
|
|
5 |
2002 |
-0,22 |
|
-0,6 |
-0,15 |
-0,67 |
6 |
2003 |
0,19 |
|
0,13 |
-0,32 |
-0,73 |
|
|
|
|
|
|
|
7 |
2004 |
0,03 |
|
0,23 |
0,48 |
-0,53 |
|
|
|
|
|
|
|
8 |
2005 |
0 |
|
0,09 |
0,03 |
-0,44 |
9 |
2006 |
-0,16 |
|
-0,4 |
-0,1 |
-0,68 |
|
|
|
|
|
|
|
10 |
2007 |
0,01 |
|
0,32 |
0,03 |
-0,37 |
|
|
|
|
|
|
|
11 |
2008 |
-0,01 |
|
0,09 |
0,02 |
-0,27 |
12 |
2009 |
-0,01 |
|
-0,01 |
-0,11 |
-0,27 |
|
|
|
|
|
|
|
13 |
2010 |
0,01 |
|
-0,05 |
0,03 |
-0,33 |
|
|
|
|
|
|
|
ISSN 1563-034Х |
Eurasian Journal of Ecology. №1 (58). 2019 |
45 |
еISSN 2617-7358 |
|
|
|
|
The ecological capacity assessment of the Ilek River with boron pollution |
||||
|
|
|
|
|
|
|
|
|
|
|
|
|
Continuation of table 3 |
|
|
|
|
|
|
|
|
|
|
|
Gradients of self-purification of the Ilek River from boron |
||
|
|
|
|
|
|
|
№№ |
Years |
|
Time aspect, mg/dm3Ч |
|
Spatial aspect, mg/dm3∙ |
|
|
|
(distance between posts) |
||||
|
|
|
|
|
|
|
|
|
Alga 1 (background) |
|
Alga 2 |
Aktobe reservoir 1 |
Alga 1 –Alga 2 |
|
|
|
|
|
|
|
14 |
2011 |
0,15 |
|
0,16 |
0,07 |
-0,32 |
15 |
2012 |
-0,08 |
|
-0,11 |
-0,03 |
-0,35 |
|
|
|
|
|
|
|
16 |
2013 |
0,03 |
|
0,2 |
0,11 |
-0,18 |
|
|
|
|
|
|
|
17 |
2014 |
-0,01 |
|
0,03 |
0,04 |
-0,14 |
18 |
2015 |
-0,06 |
|
-0,07 |
0,06 |
-0,15 |
|
|
|
|
|
|
|
19 |
2016 |
0,108 |
|
0,185 |
-0,124 |
-0,073 |
|
|
|
|
|
|
|
20 |
2017 |
-0,015 |
|
-0,404 |
0,114 |
-0,462 |
21 |
2018 |
0,035 |
|
-0,501 |
-0,002 |
-0,998 |
|
|
|
|
|
|
|
Thepredominantlypositivevaluesofthetemporal self-cleaning gradients for each post demonstrate the manifestation of natural self-purification factors
– washing the soil contaminated with Alga Chemical Factory emissions and the old sludge collector with snow melt water and precipitation. The presence of scattered negative values of temporal gradients confirms this pattern: here the change of water content of the year affects.
The negative values of the spatial aspects of the gradients are due to the excess of the ecological capacity of the Ilek River at a distance of 21.5 km downstream from the old sludge collector to the Alga 2 gauge. The change in the spatial gradient modulus by year, as well as the temporal aspects of the gradient, reflects the water characteristics of the year.
Negative values in the third column of Table 3 (Aktobe reservoir 1) show that the main part of boron, which is sorbed by silts (oozes), is deposited in the reservoir, once again emphasizing its role as a boron accumulator.
As can be seen from the record of the trend equations (Figure 3), a low value of the approximation of the curves for the posts Alga 1 and Alga 2 has been obtained. The large amplitudes of fluctuations in the boron content in surface waters at these posts are evidence that the Aktobe reservoir enters the Ilek River’s runoff groundwater, thinning-out different places in accordance with the map of hydroisogypsum. Since the eastern groundwater flow fromtheoldsludgecollectorpassestheshortestway to the river (about 400 m), its influence at groundwaterspeedsof300m/yearaffectstheconcentration of boron in the reservoir next year, and therefore in the period up to 2003 it affects the influence of the formed groundwater flow around the “wall”.
From the remaining pinch-out zones, the impact of this breakthrough of groundwater, backed by the “wall” affects a few years later, depending on the distance of this zone from the old sludge tank. Another reason for the increase in concentration on the Alga 2 post in 2016-2018. There may be a manifestation of the influence of additional sources of pollution,thefrontofpollutedgroundwaterfromwhich approached the thinning-out zones.
Thus, the curve for the Alga 2 post reflects the change in the self-cleaning process – the emergence of new sources, which can be the flow from washing the spill pipe of the sludge pipe to the new sludge collector and leaks from it. That is, there is an additional reason for exceeding the ecological capacity of the river Ilek. The observation period for the new process is short. However, the rapid increase in boron concentration (over 2 years it increased from 0.295 to 1.2 mg/dm3) indicates a significant intensification of the process of thinningout polluted underground waters in the Ilek River.
Thenextstepisassessthetimingoftherestoration of the ecological capacity to its maximum possible value (the achievement of the MPC according to the criteriafor fisheries use). To do this, we consider the curve for the Alga 2 post until 2016, when the old sludge collector acted as the main source (Figure 4).
For the process of natural self-purification, the most justified type of trend equation is an exponential relationship, ensuring a gradual decrease in concentrations without falling into negative values. To simplify the appearance of the trend line, instead of theyearofmonitoring,itspositioninthesamplewas taken. This technique and the limitation of consideration by one process significantly simplified the appearance of the trend equation and increased the ap-
46 |
Хабаршы. Экология сериясы. №1 (58). 2019 |

Pavlichenko L.M. et al.
proximation coefficient. Now, using this equation, we could calculate the self-cleaning or purifying time of the Ilek River before the ecological capacity
is restored on the forecast part of the trend equation. Calculate the values of the function for the period after 2016 (Table 4).
Figure 3 – Dynamics of changes in boron concentrations for each post over the period 1997-2018
Figure 4 – Dynamics of the boron concentrations changes in theAlga 2 post over the period 1997 -2016 yy.
Table 4 – The results of calculations of the predicted values of the boron concentration in theAlga 2, in the impact condition of the old sludge collector only
Years |
2015 |
2016 |
2017 |
… |
2076 |
2077 |
2078 |
2079 |
2080 |
|
|
|
|
|
|
|
|
|
|
|
|
The ordinal number of the year in the |
18 |
19 |
20 |
… |
79 |
80 |
81 |
82 |
83 |
|
sample |
||||||||||
|
|
|
|
|
|
|
|
|
||
Average annual boron concentration |
0,48 |
0,295 |
|
|
|
|
|
|
|
|
according to regime observations, mg/dm3 |
|
|
|
|
|
|
|
|||
Boron concentration value by |
0,442 |
0,420 |
0,400 |
… |
0,021 |
0,020 |
0,019 |
0,018 |
0,017 |
|
approximating function |
||||||||||
|
|
|
|
|
|
|
|
|
ISSN 1563-034Х |
Eurasian Journal of Ecology. №1 (58). 2019 |
47 |
еISSN 2617-7358 |
|
|

The ecological capacity assessment of the Ilek River with boron pollution
Thus, natural cleaning or purification processes from the effects of the old sludge collector can ensure the restoration of the full ecological capacity only by 2080. When exposed to additional sources of pollution, this period may be postponed for many more years, increasing pollution of the Aktobe reservoir.
Conclusions
The analysis of the map of hydroisohypsies revealed two areas on the Alga-Aktyubinsk reservoir to thinning-out boron-polluted groundwater into the Ilek River. The first zone is located near the old sludgecollector.Thelengthofthezonefromtheleft shore was 1250 m, and from the right it was about 400 m. This is the area of wedging out of groundwater with the highest concentrations of boron in groundwater. The second zone of thinning-out starts 750 m from the first, its total length was 1880 m.
Using the method of determining the flow rate of the natural groundwater flow, per 1 m of the width of the stream, greatly simplifies the procedure for calculating the volumes of polluted groundwater for the zones of their wedging out. In addition, taking into account the concentration of boron in each zone and the mass of boron carried out during the year at thinning-out. In the first zone: 391 m3 / day is disengaged, i.e. per day, 39 g of boron is carried out into the Ilek River, and for a low-flow period (~ 300 days) – about 12 kg of one year. In the second zone, 446 m3 / day, 37 g of boron per day, or 11 kg per year, are thinning-out.
The diagrams constructed on the basis of regime observations and calculated empirical curves of the dynamics changes for each post for the period
showed,thatafter2016,attheAlga2post,therewas a sharp increase in boron concentration. It is indicating that new sources of pollution were connected, which may be streams from washing the spill of the slurry pipe to the new sludge collector and leaks from it.
As a result of the overlapping of the impact of different sources of exposure, the approximation coefficient for the full sample turned out to be very low, therefore, the forecast of restoration of the ecological capacity was performed for the period when the old source of contamination was the old sludge tank. Accepting the substantiation of exponential dependence, which ensures a gradual decrease in concentrations without falling into negative values and limiting consideration of one process, significantly simplified the appearance of the trend equation and increased the approximation coefficient.
The predictive part of the trend equation was calculated self-cleaning time p. Ilek before the restoration of the full ecological capacity, the criterion of which was taken to be a boron concentration of 0.017 in accordance with the standards of water bodies for fisheries. It was shown that natural purification processes from the effects of only the old sludgecollectorcanensuretherestorationofthe full ecological capacity only by 2080. If exposed to additionalsourcesofpollution,thisperiodcanbepostponed for many more years, increasing pollution of the Aktobe reservoir.
The direction of further research should be to test the hypothesis of connecting additional sources of pollution by building a new map of hydroisogypsumwithagroundwaterflowpatternandcalculating the time the pollution front moves to the thinningout zones.
References
БураковМ.М.,ПавличенкоЛ.М.(2011)Масштабыреализациипроектапоочисткеподземныхводдолиныр.Илекотбора
//Материалы Всероссийской научной конференции «Проблемы гидрогеологии, инженерной геологии и гидроэкологии». – 2011. – С.614-622.
Berdenov Zh.G., Dzhanaliyeva G.M. Landscape and geochemical features of man-made Pollution zones ofAktobeAgglomerations // Communications. – 2015. – Vol. 38, no 2. – P. 852-860.
Справочник месторождений Казахстана. Подземные воды // Министерство индустрии и инфраструктурного развития Республики Казахстан. Комитет геологии и недропользования. Web site: http://info.geology.gov.kz/ru, дата обращения: 11.09.2018.
Russell A., Ghalaieny M, Gazdiyeva B., Zhumabayeva S., Kurmanbayeva A., Akhmetov K., Mukanov Ye., McCann M., Ali M., TuckerA., Vitolo C., Althonayan A. A Spatial Survey of Environmental Indicators for Kazakhstan: An Examination of Current Conditions and Future Need // International Journal of Environmental Research. – 2018. – Vol. 12. – P. 735–748.
MAVICAIR. Руководство пользователя (2018). Web site: https://www.dji.com/mavic-air, дата обращения: 16.04.2018. Давидович Г.Т. Отчет о результатах работ по составлению геоэкологической карты Актюбинской области (1 и 2 этапы)
//РНПИЦ «Казэкология». – 1994. – C. 35.
Fetter Jr. C.W. Applied Hydrogeology, 4th Edition. // Univ. of Wisconsin. – 2000. – P.113-148.
48 |
Хабаршы. Экология сериясы. №1 (58). 2019 |

Pavlichenko L.M. et al.
Tang, Y., Zhou, J., Yang, P., Yan, J., Zhou, N. Groundwater Engineering, Springer Environmental Science and Engineering // Springer-Verlag Berlin Heidelberg and Tongji University Press. – 2017. – P. 35-111.
Pavlichenko L., Rysmagambetova A., Tanybayeva A., Minzhanova G. The degree of boron contamination of the underground and surface water of the Ilek River valley // 17th International Multidisciplinary Scientific GeoConference on Ecology, Economics, Education and Legislation. – 2017. – Vol.17. – P. 967-974.
Kovalevsky V. S., Kruseman G. P., Rushton K. R. Ground water studies // IHP-VI, Series on Ground water. UNESCO – 2004.
– No.3. – P. 23-40.
Информационный бюллетень о состоянии окружающей среды Министерства энергетики Республики Казахстан. РГП «КАЗГИДРОМЕТ». Web site: https://kazhydromet.kz/ru/bulleten/.
Koshmaganbetova G., Kudabaeva Kh., Nuftieva A., Bazargaliev Ye. Boron and Silicon Content in the Hair of Schoolchildren with Endemic Goiter in Oil-Gas Producing Areas of West Kazakhstan // International Conference of Social Science, Medicine and Nursing. – 2015. – P. 117–120.
Turson Hairet, Weilong Wang, Yuan Li, Shengsheng Li. Assessment of Water Ecological Carrying Capacity based on Ecological Network Structure // Journal of Environmental Accounting and Management. – 2014. – Vol. 2(4). – P. 335-345.
Parks J.L., Edwards M. Boron in the environment // Crit Rev EnvironSci Technol. – 2005. – Vol. 35(2), P. 81–114.
Xu Ling, Liu Zhihong, Du Jing. Study on Evaluation of Water Ecological Carrying Capacity // 010 International Conference on Biology, Environment and Chemistry IPCBEE. – 2011. – Vol.1, P. 458-462.
References
Berdenov Zh.G., Dzhanaliyeva G.M. (2015) Landscape and geochemical features of man-made Pollution zones of Aktobe Agglomerations. Communications, vol. 38 no 2., pp. 852-860.
Burakov M.M., Pavlichenko L.M. (2011) Masshtaby realizacii proekta po ochistke podzemnyh vod doliny r. Ilek ot bora [The scope of the project to clean up the groundwater Ilek river valley from boron]. Materialy Vserossijskoj nauchnoj konferencii «Problemy gidrogeologii, inzhenernoj geologii i gidrojekologii», pp. 614-622.
Davidovich G.T. (1994) Report on the results of work on the compilation of a geoecological map of the Aktobe region (stages 1 and 2) [Otchet o rezul’tatah rabot po sostavleniju geojekologicheskoj karty Aktjubinskoj oblasti (1 i 2 jetapy)]. RRPIS “Kazekologia”, pp. 35.
Fetter Jr. C.W. (2000) Applied Hydrogeology, 4th Edition. Univ. of Wisconsin, pp. 113-148.
Information Bulletin on the State of the Environment of the Republic of Kazakhstan [«Informacionnyj bjulleten’ o sostojanii okruzhajushhej sredy Respubliki Kazakhstan»]. Ministry of Energy of the Republic of Kazakhstan. RSE “KazHydroMet”. Web site: https://kazhydromet.kz/ru/bulleten/.
Koshmaganbetova G., Kudabaeva Kh., Nuftieva A., Bazargaliev Ye. (2015) Boron and Silicon Content in the Hair of Schoolchildren with Endemic Goiter in Oil-Gas Producing Areas of West Kazakhstan. International Conference of Social Science, Medicine and Nursing, pp. 117–120.
Kovalevsky V. S., Kruseman G. P., Rushton K. R. (2004) Ground water studies. IHP-VI, Series on Ground water. UNESCO, no.3, pp. 23-40.
Manual Mavic Air (2018). Web site: https://www.dji.com/mavic-air. Last modified: 16.04.2018.
Parks J.L., Edwards M. (2005) Boron in the environment. Crit Rev EnvironSci Technol, vol. 35(2), pp. 81–114.
Pavlichenko L., Rysmagambetova A., Tanybayeva A., Minzhanova G. (2017) The degree of boron contamination of the underground and surface water of the Ilek River valley. 17th International Multidisciplinary Scientific GeoConference on Ecology, Economics, Education and Legislation, vol.17, pp. 967-974.
Reference book of deposits of Kazakhstan. The groundwater. (2018) Ministry of Industry and Infrastructural Development of the Republic of Kazakhstan. Committee of Geology and Subsoil Use. Web site: http://info.geology.gov.kz/ru. Last modified: 11.09.2018.
Russell A., Ghalaieny M, Gazdiyeva B., Zhumabayeva S., Kurmanbayeva A., Akhmetov K., Mukanov Ye., McCann M., Ali M., Tucker A., Vitolo C., Althonayan A. (2018) A Spatial Survey of Environmental Indicators for Kazakhstan: An Examination of Current Conditions and Future Needs. International Journal of Environmental Research, vol.12, pp. 735–748.
Tang, Y., Zhou, J., Yang, P., Yan, J., Zhou, N. (2017) Groundwater Engineering, Springer Environmental Science and Engineering. Springer-Verlag Berlin Heidelberg and Tongji University Press, pp. 35-111.
Turson Hairet, Weilong Wang, Yuan Li, Shengsheng Li (2014) Assessment of Water Ecological Carrying Capacity based on Ecological Network Structure. Journal of Environmental Accounting and Management, vol. 2(4), pp. 335-345.
Xu Ling, Liu Zhihong, Du Jing (2011) Study on Evaluation of Water Ecological Carrying Capacity. 010 International Conference on Biology, Environment and Chemistry IPCBEE, vol.1, pp. 458-462.
ISSN 1563-034Х |
Eurasian Journal of Ecology. №1 (58). 2019 |
49 |
еISSN 2617-7358 |
|
|
МРНТИ 34.23; 34.15; 34.25.21
Сагымбай А.Б.1, Нусупбаева Г.Е.2, Тлеумбетова Н.Ж.3, Муталиева А.С.4, Нурпейсова А.С.5, Джусупова Д.Б.6, Дигель И.7
1студент PhD-докторантуры, e-mail: altinai_S@mail.ru
2заведующая Референс лабораторией, e-mail: gnusupbaeva@mail.ru
3врач-вирусолог, e-mail: nn_nazym@mail.ru 4врач-вирусолог, e-mail: aknur.kz@mail.ru
5студент PhD-докторантуры, e-mail: nurai1005@mail.ru
6доктор биологических наук, профессор, e-mail: dariya_2507@mail.ru
7PhD, e-mail: digel@fh-aahen.de
1,5,6 Казахский национальный педагогический университет имени Абая, Казахстан, г. Алматы 2,3,4 Референс лаборатория по контролю за вирусными инфекциями
Филиала «Научно-практический центр санитарно-эпидемиологической экспертизы и мониторинга» НЦОЗ МЗ РК, Казахстан, г. Алматы
7Институт прикладных исследований, Германия, г. Аахен
МОЛЕКУЛЯРНО-ГЕНЕТИЧЕСКИЕ ОСОБЕННОСТИ ЭПИДЕМИЧЕСКОГО СЕЗОНА 2017-2018 ГГ. ПО ГРИППУ В КАЗАХСТАНЕ
Вирусы гриппа представляют собой постоянную проблему глобального общественного здравоохранения. Вирусологическое наблюдение за гриппом является важным инструментом для раннего выявления новых генетических вариантов вирусов эпидемиологического и клиническое значения.
Цельюданногоисследованияявляетсяопределениемолекулярно-генетическиххарактеристик вирусов гриппа, циркулировавших на территории Казахстана в течение эпидемиологического сезона 2017-2018 гг. Были изучены последовательности генов двенадцати штаммов вируса гриппа А (подтип H1N1pdm09 – 9, подтип H3N2 – 3) и десяти штаммов вируса гриппа В (генотип В/Victoria – 2, генотип B/Yamagata – 8), выделенных в недозорных сайтах республики. По данным филогенетического анализа, все секвенированные штаммы вируса гриппа А/Н1N1pdm09 принадлежали к клайду 6В.1. Вирусы гриппа A/H3N2 отличились значительным генетическим разнообразием – исследованные вирусы принадлежали к нескольким филогенетическим группам и подгруппам с преобладанием вирусов, подобные вакцинному штамму. Установлено, что преобладающая часть выявленных вирусов гриппа В на территории Казахстана, принадлежала к линии B/Yamagata и относилась к клайду 3. Результаты этого исследования подтверждают важность непрерывного мониторинга мутационной изменчивости и филогенетического анализа циркулирующих штаммов в выборе вакцинных штаммов для специфической профилактики гриппа и противовирусных препаратов.
Ключевые слова: вирус гриппа, молекулярно-генетический анализ, филогенетический анализ, вакцинные штаммы.
© 2019 Al-Farabi Kazakh National University