

© 2007 Nature Publishing Group http://www.nature.com/natureprotocols
PROTOCOL
Bioconjugated quantum dots for multiplexed and quantitative immunohistochemistry
Yun Xing1, Qaiser Chaudry2, Christopher Shen1, Koon Yin Kong2, Haiyen E Zhau3, Leland W Chung3, John A Petros3,4, Ruth M O’Regan5, Maksym V Yezhelyev5, Jonathan W Simons1,5, May D Wang1,2,5 & Shuming Nie1,5
1Department of Biomedical Engineering, Emory University and Georgia Institute of Technology, 101 Woodruff Circle Suite 1001, Atlanta, Georgia 30322, USA. 2Department of Electrical and Computer Engineering, Georgia Institute of Technology, Atlanta, Georgia 30332, USA. 3Department of Urology, Emory University School of Medicine, Atlanta, Georgia 30322, USA. 4Veteran Affairs Medical Center, Atlanta, Georgia, 30333, USA. 5Department of Hematology and Oncology and the Winship Cancer Institute, Emory University School of Medicine, Atlanta, Georgia 30322, USA. Correspondence should be addressed to M.D.W. (maywang@bme.gatech.edu) or S.N. (snie@emory.edu).
Published online 3 May 2007; doi:10.1038/nprot.2007.107
Bioconjugated quantum dots (QDs) provide a new class of biological labels for evaluating biomolecular signatures (biomarkers) on intact cells and tissue specimens. In particular, the use of multicolor QD probes in immunohistochemistry is considered one of the most important and clinically relevant applications. At present, however, clinical applications of QD-based immunohistochemistry have achieved only limited success. A major bottleneck is the lack of robust protocols to define the key parameters and steps. Here, we describe our recent experience, preliminary results and detailed protocols for QD–antibody conjugation, tissue specimen preparation, multicolor QD staining, image processing and biomarker quantification. The results demonstrate that bioconjugated QDs can be used for multiplexed profiling of molecular biomarkers, and ultimately for correlation with disease progression and response to therapy. In general, QD bioconjugation is completed within 1 day, and multiplexed molecular profiling takes 1–3 days depending on the number of biomarkers and QD probes used.
INTRODUCTION
QDs are tiny light-emitting particles on the nanometer scale, and are emerging as a new class of fluorescent labels for biology and medicine1–11. In comparison with organic dyes and fluorescent proteins, QDs have unique optical and electronic properties such as size-tunable light emission, superior signal brightness, resistance to photobleaching and simultaneous excitation of multiple fluorescence colors. These properties are most promising for improving the sensitivity and multiplexing capabilities of molecular histopathology and disease diagnosis. Recent advances have led to highly bright and stable QD probes that are well suited for profiling genetic and protein biomarkers in intact cells and clinical tissue specimens12–14. In contrast to in vivo imaging applications where the potential toxicity of cadmium-containing QDs is a major concern, immunohistological staining is performed on in vitro or ex vivo clinical patient samples. As a result, the use of multicolor QD probes in immunohistochemistry (IHC) is likely one of the most important and clinically relevant applications in the near term.
In recent years, several groups have used QD probes for fluorescence immunostaining of fixed cells and tissue specimens15–21. However, medical applications of QD-based immunohistochemistry have not achieved widespread adaptation or significant clinical success. A major problem is the lack of robust protocols and experimental procedures to define the key factors and steps involved in QD immunohistochemical staining and data analysis. In particular, there are no consensuses on methods for QD– antibody (QD–Ab) bioconjugation, tissue specimen preparation, multicolor QD staining, image processing and data quantification. Faced with these needs, we have developed anti- body-conjugated QDs for multiplexed and quantitative (or semiquantitative) IHC, and have achieved five-color molecular profiling on formalin-fixed and paraffin-embedded (FFPE) clinical tissue
specimens. We have also optimized the experimental procedures for QD bioconjugation, tissue specimen preparation, multi-
color staining, image processing and analysis, and biomarker quantification6,12–14.
In this paper, we describe our recent experience, preliminary results and detailed experimental procedures. We also discuss the development of QD–Ab conjugates for quantitative and multiplexed IHC, an important but challenging goal that has not been achieved for diagnostic pathology. In contrast to standard hematoxylin and eosin tissue staining, multicolor QD staining allows the use of one antibody-QD conjugate to target a housekeeping gene product, thus providing an internal standard for signal calibration and quantification. This ‘‘ratiometric’’ staining approach to IHC can overcome many problems encountered with traditional methods22. In addition to clinical pathology, we envision that sensitive QD-based immunoassays represent a new direction for multiplexed detection of category A bioterrorism
agents such as anthrax, plaque, botulism and viral hemorrhagic fevers23.
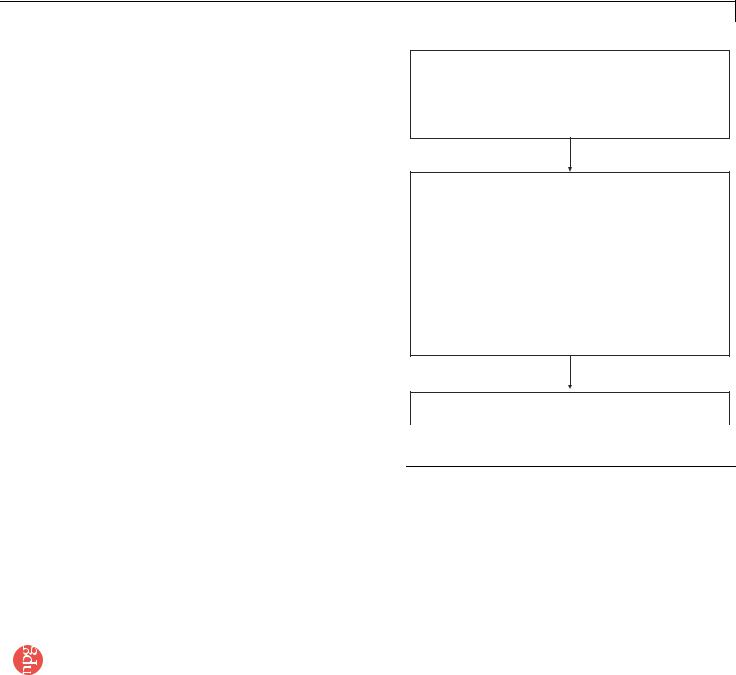
The procedure
A flowchart of the procedure with timing information is shown in Figure 1. Detailed protocols for QD–Ab conjugation (part 1) and for QD staining of cellular or tissue specimens (part 2) are
given in the PROCEDURE section, followed by a |
discussion |
of imaging data acquisition, processing and analysis |
(part 3). |
A software tool for quantitative IHC (called Q-IHC) is given in Box 1 and Figure 2. In addition, excellent protocols have been published for QD conjugation to luciferase (self-illuminating QDs)24, QD–protein conjugation via dihydrolipoic acid and noncovalent self-assembly25, and using bioconjugated QDs for tracking the motion of membrane molecules26.
1152 | VOL.2 NO.5 | 2007 | NATURE PROTOCOLS
© 2007 Nature Publishing Group http://www.nature.com/natureprotocols
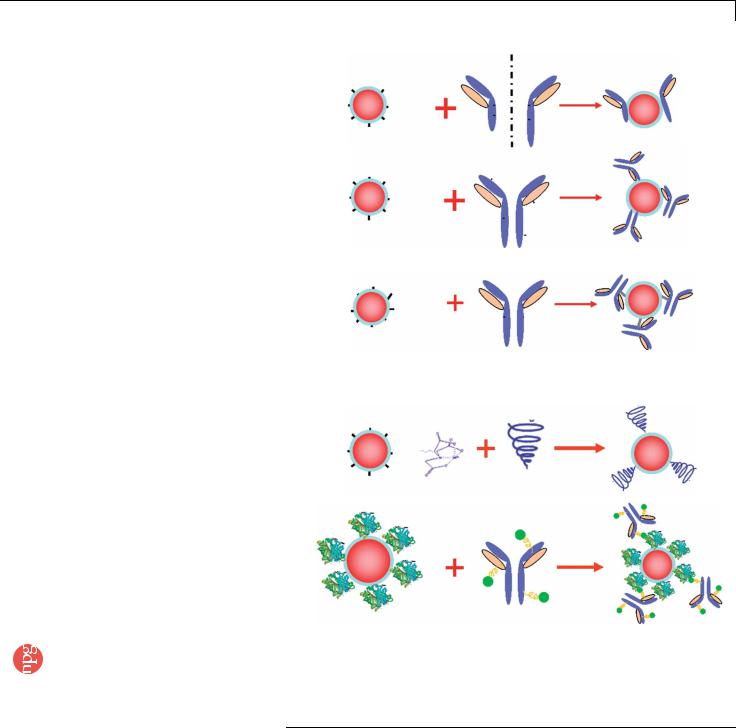
QD bioconjugation
As schematically illustrated in Figure 3, QD conjugation to biomolecules can be carried out by electrostatic binding, noncovalent biotin–avidin binding, direct covalent crosslinking and nickel-based histidine tagging. Mattoussi and co-workers25,27 were the first to use an adaptor or fusion protein for IgG antibody coupling based on electrostatic interactions. The adaptor protein has a positively charged leucine zipper domain for electrostatic binding to QDs and a protein G domain for binding to the antibody Fc region. Using such a ‘‘bifunctional’’ adaptor, the Fc end of the antibody is connected to the QD surface, with the targetspecific F(ab¢)2 domains facing outward. For histidine-tagged peptides or antibodies, it is also possible to use the nickelnitrilotriacetic acid complex (Ni-NTA) as a bifunctional adaptor for QD bioconjugation. In this case, the nitriloacetic acid group is covalently linked to the QD encapsulation polymer whereas histidinetagged antibodies bind to nickel ions (Ni2+) by chelation. In comparison with biotin–avidin binding, this ‘‘his-tag’’ method has several advantages such as a controlled orientation of the binding ligand (a histidine tag can be conveniently fused to proteins and peptides at a particular site), compact overall probe sizes and low production costs. Although the stability of the histidine–nickel attachment could be a problem under the harsh conditions of immunohistochemical staining, previous research has shown that the interaction of 6 His with Ni-NTA is virtually unaffected by high salt (up to 1 M), nonionic detergents (Triton X-100 or Tween 20 up to 1%, w/w), organic solvents, ethanol or glycerol to 30%, reducing agents (b-mercaptoethanol up to 10 mM) (see ref. 28) or highly denaturing conditions such as 8 M urea or 6 M guanidine hydrochloride29. Based on the 6-histidine epitope, we have not encountered major stability problems for the bioconjugated QDs in PBS buffer at room temperature (RT) for a period of 2–3 weeks at 4 1C.
Covalent QD conjugation is most commonly based on crosslinking reactions between amine and carboxylic acid groups (catalyzed by carbodiimide) (Step 1C), between amine and sulfhydryl groups (catalyzed by maleimide) (Step 1A) or between aldehyde and hydrazide functions. An advantage of the amine–carboxylic acid crosslinking method is that most proteins contain primary amine and carboxylic acid groups, and do not need chemical modifications before QD conjugation. In contrast, free and accessible sulfhydryl groups are rare in native biomolecules and are often unstable in the presence of oxygen. Another method for covalent conjugation involves oxidizing carbohydrate groups on the antibody’s Fc portion to reactive aldehyde groups, which are then covalently linked to QDs (Step 1B). Because the carbohydrate’s position is known on the antibody, this approach allows sitespecific QD conjugation at relatively simple QD–Ab ratios. The properties and performance of these various QD–Ab conjugates are summarized in Table 1. In this contribution, we present four different, detailed methods for preparing QD–Ab conjugates for cell and tissue staining.
Preparation of cell and tissue specimens
To optimize the procedures for specimen preparation, we have studied and compared fresh cells, frozen cells (stored at 80 1C), fixed cell pellets, as well as archived patient specimens (FFPE samples). Cells collected fresh from subculture are relatively easy to be stained and often show the best morphologies. For optimal
PROTOCOL
Part I QD–antibody bioconjugation (a few hours to a couple of days depending on the method chosen)
1.Pretreatment of QDs and the antibody ~30 min to a couple of days depending on the method chosen
2.QD–antibody conjugation ~1–4 h depending upon the method chosen.
3.Purification of QD–antibody conjugate from free excess antibody via size exclusion column ~30 min.
Part II Multiplexed QD staining of cellular or tissues specimens (a few hours to a few days depending on the number of biomarkers studied and method chosen)
1.Sample preparation: fixation and permeabilization for fresh cells on chamber slides (~30 min); deparaffinization (~30 min) and antigen retrieval (~45 min) for FFPE samples (cell pellets or clinical tissue specimens)
2.Blocking ~30 min
3.Primary antibody incubation ~1 h at RT or overnight at 4 °C (for primary antibodies only) OR ~2 – 4 h at RT if using QD– primary antibody conjugates (go to Step 5 directly after this)
4.Secondary antibody incubation ~2 h at RT or overnight at 4 °C (if using QD-secondary antibody conjugates)
5.Repeat Steps 2– 4 if two antibodies are of the same animal origin and QD-secondary antibody conjugates are used
6.Nuclear counterstaining ~5 min
7.Mount and coverslip ~5 min
Part III Imaging and spectral analysis (a few hours to a day depending on the number of samples imaged and number of images/spectra captured)
Figure 1 | Flowchart and timing for QD conjugation and immunohistochemical staining of cells and tissue specimens.
cell membrane and cytoplasmic staining, however, the fresh cells often need to be fixed and permeabilized. Nuclear staining requires an additional proteinase K treatment step. For frozen cell specimens that are fixed with acetone/methanol before cryo-storage, no permeabilization is needed. For paraffin-embedded tissue specimens, we recommend an antigen retrieval step, as is commonly used in IHC30. This step is not always necessary, but antigen retrieval permits stronger staining signals. Typical antigen retrieval methods include heating, protease digestion and treatment under strong acidic conditions30. Selection of an antigen retrieval method depends much on the specific primary antibody to be used. We recommend the use of a pressurized cooker for heating (5 min at 120 1C) in citrate (pH 6.0) or EDTA (pH 8.0) buffer. Heating in EDTA buffer often leads to brighter staining signals, and is more suitable for low-abundance antigens or antigens with inaccessible epitopes. However, the pH of the buffers and the heating conditions could be too harsh for some tissue slides and could cause tissues to peel off. For best results, paraffin-mounted tissue specimens should be placed on coated slides (superfrost, positively charged) and baked to adhere firmly to the specimens, before subjecting to further steps of the described protocols. We present detailed procedures for QD staining of three types of samples: cells fresh from subculture (Step 2A), frozen cells samples (Step 2B) and FFPE cell/tissue specimens (Step 2C). Each sample type requires a different pretreatment method before QD staining.
Multicolor QD staining
Depending on the types of QD bioconjugates and the primary antibodies used, multiplexed labeling of cells/tissue specimens can
NATURE PROTOCOLS | VOL.2 NO.5 | 2007 | 1153

© 2007 Nature Publishing Group http://www.nature.com/natureprotocols
PROTOCOL
BOX 1 | Q-IHC - A SOFTWARE TOOL FOR QUANTITATIVE ANALYSIS OF IMMUNOHISTOCHEMICAL DATA
We have developed an integrated image processing and bioinformatics software tool (called Q-IHC) for quantitative analysis of biomarker expression and distribution in immunohistochemical (IHC) images (see Figure 2). In comparison to previous image processing software for automated feature extraction and quantitative analysis50,51, our software system is capable of handling imaging data from both traditional and QD-based IHC. To measure the distribution of labeled antigens, multiple slides of IHC imaging data are acquired to capture selected tissue structures. After image acquisition, an image processing module carries out automatic boundary identification, semi-automatic image segmentation, and color-based tissue classification based on biomarker staining. Then, an image analysis module quantifies the various biomarker features into numerical values. These values become distinct features and are used for comparison with clinical diagnosis. After validation by a physician, the quantitative data and rules describing biomarker features are stored in a database. This semi-automatic image processing and quantification system is designed to provide molecular profiling data that are more objective, more consistent, and more reproducible than completely manual or automated quantification methods. Our software tools process image files from slide scanners in Matlab, which is a collection of various engineering processing
tools. We have designed a user-friendly graphical user interface that allows users to give input and feedback to improve the system quality.
The Q-IHC tool is available to academic and nonprofit research institutions from the Emory-Georgia Tech Center of Cancer Nanotechnology Excellence, funded by the National Cancer Institute (NCI), the Georgia Cancer Coalition (GCC), the Georgia Research Alliance (GRA), Emory University, and Georgia Institute of Technology. For further information on software download and deployment, go to: http://www.bio-miblab.org. Correspondence and requests concerning image analysis and biocomputing should be addressed to Dr. May D. Wang, Department of Biomedical Engineering, Georgia Tech and Emory University, 313 Ferst Drive, UA Whitaker Building 4106, Atlanta, Georgia 30332, USA, email address: maywang@bme.gatech.edu.
be achieved by either direct or indirect staining procedures. For direct staining, each primary antibody is conjugated to a QD of a different color, and a mixture of several different QD–Ab conjugates is applied to the tissue specimen in a single step (Step 3B). Although this method is fast and efficient, some primary antibodies may not survive the QD conjugation process and their binding properties are likely altered by covalent modifications at either -NH2 or -COOH sites. Also, QD conjugation to primary antibodies does not work well when the original antibody buffer contains bovine serum albumin (BSA) or other culture medium proteins. Further, the reagents costs could become considerably high because each primary antibody is conjugated to just one type of QD, and none of the QD bioconjugates could
Data acquisition |
|
|
Image processing |
|
|
Quantification |
|
|
|
|
|
||||
|
|
|
|
|
|
|
|
|
|
|
|
|
|
|
|
Clinician
Molecular
profiling
Database
Figure 2 | Block diagram of Q-IHC, an integrated software system for image processing and biomarker quantification of immunohistochemical data.
be used as a common reagent for staining of antigen or antibody classes.
These problems can be addressed by indirect QD staining, in which QD–secondary antibody conjugates are used to recognize primary antibodies (unlabeled) (Step 3A). The main advantages of this method are its flexibility, lower costs and the reduced constraint on primary antibodies. A typical multicolor labeling procedure would involve the following steps: blocking - 1st set of primary antibodies (each raised from a different animal species) - 1st QD–secondary antibody conjugates (each against a different animal species) - blocking - 2nd set of primary antibodies - 2nd set of secondary antibodies - so on. Despite these multiple blocking/staining/washing steps, we have achieved excellent results for five-color molecular profiling of cancer cells and tissue specimens (see below). It should be emphasized that careful control studies must be planned and included for data validation and interpretation. For QD–primary antibody conjugates, a negative control experiment is to saturate the antigens with isotypeand species-matched immunoglobulin molecules before QD staining. Additional controls should include the use of free QDs or BSA-QD conjugates to evaluate nonspecific binding and staining. For QD–secondary antibody conjugates, one key control is to determine the level of nonspecific binding when the primary antibody is purposely omitted from the staining protocols. For multiplexing purposes (Step 3C), QD–primary antibody conjugates will be the best choice. However, some antibodies may not be suitable for chemical modification. In these cases, QD–secondary antibody conjugates can be used instead. In the following, we present detailed procedures for both types of conjugates.
Imaging data acquisition, processing, and analysis
In our laboratory, true-color fluorescence images are obtained by using an Olympus IX70 epifluorescence microscope equipped with
1154 | VOL.2 NO.5 | 2007 | NATURE PROTOCOLS
© 2007 Nature Publishing Group http://www.nature.com/natureprotocols
a long-pass filter, a mercury lamp, and a digital color CCD camera. Fluorescence spectroscopy is carried out by attaching a spectrometer to the microscope side port. By using objectives with different magnifications (zooming in and out), this microspectroscopic system allows one to acquire wavelength-resolved spectra from an individual cell as well as from a cluster of cells. At high magnifications (e.g., 100 ), the spectra provide information on individual cells, while at low magnifications (2 , 10 ), the spectra provide averaged signals for 10–100 cells. For data calibration, we calculate the average signal intensities (e.g., 40 103 arbitrary fluorescence units) for cell lines with over-expressed antigens (e.g., breast cancer cells with over-expressed Her2). Then we set this value as 100% and calculate the signal intensities of other cell lines as a percentage from this maximum. For clinical tissue specimens, we similarly measure the fluorescence intensity from a series of samples with the highest Her2 expression. This intensity is set as 100% and is used for further calculations. To ensure statistical validity, multiple spectra (30–50) of representative regions are taken and are averaged in the analysis.
a COOH
2 NH
COOH
b H O O C
HOOC
COOH
c
2 CONHNH
2 CONHNH
2 CONHNH
|
COOH |
|
|
NH2 |
|
|
C |
|
|
O |
|
NH |
O |
|
H |
|
|
|
|
|
2 |
|
|
COOH |
COOH |
|
|
|
|
|
COOH |
|
|
C |
|
COOH |
OO |
|
H |
|
|
|
|
|
2 |
|
|
CONHNH |
CONHNH |
2 |
|
|
|
|
CONHNH2 |
|
CONHNH |
CONHNH |
|
2 |
|
|
|
|
|
2 |
|
|
Dihydrazide modified carboxylated QD
O |
COOH |
|
|
|
d |
|
|
OH |
|
H |
|
CO |
|
|
O |
|
|
|
|
C |
|
|
|
|
HCOO |
|
COOH |
|
|
COOH |
|
C |
O |
|
|
COOH |
O |
|
|
|
|
H |
NTA-Ni |
|
|
|
|
||
|
|
|
|
|
Image segmentation. For segmentation of |
e |
|
cell and tissue images, we have developed |
||
|
||
level-set algorithms using partial differential |
|
|
equations (PDEs) for identification of |
|
|
cellular regions versus non-cellular regions. |
|
|
The algorithms are independent of the |
|
|
initial conditions, and can automatically |
|
|
select the cell-region boundaries. For iden- |
QD-strepavidin |
|
tification of special tissue structures, such as |
|
a prostate gland, we have developed a semiautomatic method that provides more user control for monitoring segmentation accuracy and sensitivity. Specifically, we developed a custom Graphics User Interface (GUI) based on the intelligent scissor (IS) algorithm31,32. This graphics interface allows the user to control the quantification
process because the user often has a priori knowledge of staining color and biomarker locations (i.e., cell nucleus, cell membrane, cytoplasm, or the extracellular matrix). The user can start the segmentation process by moving the mouse cursor to a ‘‘region of interest’’ (ROI) such as an isolated cancer cell or a prostate gland, and then mark this region with a few ‘‘seed’’ points (user-selected points to delineate cell or gland boundaries). Then, the image processing system interactively computes multiple paths from the user-selected points to other neighboring points in the image, and extracts features such as edges (discontinuity in color or intensity) or areas (regions sharing similar textures). The one path that provides the optimal feature extraction is the solution. As one
PROTOCOL
SH |
SMCC |
|
HS |
||
SH |
HS |
|
Antibody fragments |
||
NH |
2 |
|
|
|
|
|
|
EDC |
2HN |
|
NH |
|
2 |
|
NH2
OHC CHO
Periodate oxidized antibody
Binding site
His0
His-tagged peptide
NATURE PROTOCOLS | VOL.2 NO.5 | 2007 | 1155
© 2007 Nature Publishing Group http://www.nature.com/natureprotocols
PROTOCOL
TABLE 1 | Methods for QD bioconjugation, conjugate chararacteristcs and comparative performance for immunohistochemical staining.
Conjugation method Sulfhydryl (covalent) Amide (covalent) Fc-sugar (covalent) His-tag (noncovalent) Biotin–avidin (noncovalent)
Conjugated ligand |
Ab fragments |
Whole Ab |
Whole Ab |
ScFv or Peptide |
Whole Ab |
Site specificity |
Yes |
No |
Yes |
Yes |
No |
Ligand orientation |
Fixed |
Random |
Fixed |
Fixed |
Random or fixeda |
Ab/QD ratiob |
B4 |
B15 |
B15 |
B3–25 |
o3 |
Staining specificity |
Medium |
Low |
Medium |
High |
High |
Staining brightness |
Low |
High |
Very high |
High |
Medium |
Background noise |
Low |
Medium |
Low |
Low |
Low |
Special conditions |
Protein-free buffer |
None |
Carbohydrate |
None |
None |
Reagent costs |
Medium |
Low |
Medium |
High |
High |
Overall performance |
Fair |
Poor |
Excellent |
Excellent |
Good |
|
|
|
|
|
|
Notes: the data were derived from the authors’ laboratories at Emory University School of Medicine and Georgia Institute of Technology. Probe comparisons were made under identical experimental conditions. Performance evaluations were based on a number of parameters such as level of nonspecific staining, background noise and specific signal brightness. All QD-Ab conjugates are stable for 2–4 weeks at 4 1C.
aThe orientation can be random or fixed based on the biotinylation method. bThese are approximate estimates based on the number of functional groups on the QD and the molar ratio of starting materials under the assumption that 50% of the starting antibody molecules are conjugated to QDs. The actual number of antibodies per QD could vary depending on the reaction conditions.
search algorithm treats the image as a weighted graph. Each pixel represents a node with directed and weighted edges that connect with its eight adjacent neighbors. As the mouse cursor moves, the optimal path from the pointer position to the seed point is displayed. This path allows the user to select an optimal contour segment that visually corresponds to a portion of the desired object boundary. As the mouse cursor moves, the optimal path from the
pointer position to the ‘‘seed’’ point is calculated. When the mouse
pointer comes in proximity to an object edge, a live wire boundary snaps to and wraps around the object of interest31,32, as highlighted
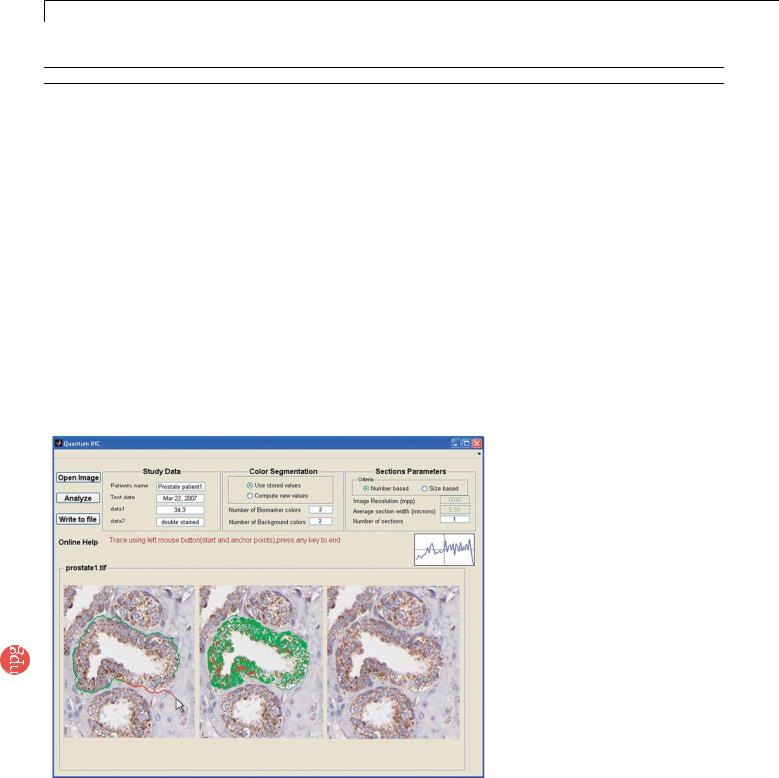
in red contour color in Figure 4. If the user finds the contour segment visually corresponds to a portion of the desired object boundary, double clicking the mouse fixes the contour and changes its color to green. This design enables the user to play a part in the process of computer-based contour feature extraction, leading to more reliable and more repeatable results. After the cellular and tissue shapes are identified by image segmentation, further data analysis will only focus on ROIs. The key next step is to classify each pixel to a biomarker or to the background by using K-means
clustering34.
Figure 4 | Computer screen showing prostate tissue specimens stained with traditional IHC and the graphical interface for image analysis and biomarker quantification. Left panel: the user can pick a starting ‘‘seed’’ by moving the mouse to the top of one prostate gland. As the mouse is placed by the user along one side of the gland, the image processing system will compute the connection from this ‘‘seed’’ point to all neighboring points. Multiple possible connecting paths will be generated, and then the optimal path will be labeled (i.e., highlighted in green color edge). This calculation occurs interactively in real time. Middle panel: the use of K-means clustering to segment QD-stained tissue images, with cellular structures being highlighted by light green and light red colors. Right panel: automated counting of brown staining cells (red dots) and blue-staining cells (blue dots). The IHC images openly available
from the Human Proteome Organization (HUPO) are used in this analysis, demonstrating the broad utility of our software system. Detailed staining information: antibody CAB002311, protein EnsEMBL ID: ENSP00000304146, netrin receptor DCC precursor in prostate tissue; see http://www.proteinatlas.org.
K-means clustering. In addition to determining the staining intensity of biomarkers, it is important to know the location of biomarkers in an ROI, especially for multi- plex-QD labeled cell and tissue specimens. We have used the K-means algorithm because it has three distinctive advantages:
(a)no requirement for human interaction,
(b)ease of implementation, and (c) high performance. K-means is a widely used technique for clustering of multi-spectral data34, and is based on the sum of least squares criterion. For example, in two-color QD staining of prostate cancer tissues, we can define each color of the biomarker and the background as one cluster. For k-1 biomarker and the background, the first step is to define k centroids (center positions), one for each cluster. These centroids may be initialized by predefined values, or may be placed far away from each other to avoid local minima convergence. The next step is to take each point belonging to a given data set and associate it to the nearest centroid. When this initial grouping is
1156 | VOL.2 NO.5 | 2007 | NATURE PROTOCOLS