

Статистика пожаров / Центр пожарной статистики CTIF / ctif_report26_world_fire_statistics_2021
.pdf19
_____________________________________________________________________________________________
Sources / Источники / Quellen
1.Data on Fire Statistics of 23 countries in 2019 (Data obtained from responses to the requests of the Fire Statistics Center).
2.Fire and Fire Safety in 2019, Statistics Journal, Statistics of Fires and their analysis – Moscow, Russia, VNIIPO, 2020.
3.Les Statistiques des Services d’Incendie et de Secours (Statistics of fire service calls in France) – Edition 2020.
4.The Singapore Civil Defense Force. Annual report, 2020.
5.Fire and rescue statistical release. Great Britain. Department for Communities and Local Government 2020.
6.Annual report. New Zealand Fire service commission. 2020.
7.Hong Kong Fire Services Department Review 2020.
8.LFB | Fire Facts. Fires in Greater London in 2019. www.london-fire.gov.ukand on
9.WHO. Health statistics and information systems. https://www.who.int/healthinfo/global_burden_disease/estimates/en/index1.htm l
Contacts / Контакты / Kontakt
Prof. Dr. Sergei V. Sokolov,
E-mail: albrus-ssv@yandex.ru
Tel: +7 903 299 6650, Fax:(007 499) 185 0560;
Menginskogo 32-3-303, 129281 Moscow, Russia
Dr. Ing. Peter Wagner,
E-mail: drpeterwagner@freenet.de
Tel: +49 30 56497790;
Tolkmittstr.49A, D-12621 Berlin, Germany
Marty Ahrens
E-Mail: mahrens@nfpa.org
NFPA Fire Analysis Research Manager
_____________________________________________________________________________________________
© Copyright by Center for Fire Statistics of CTIF 2021

20
_____________________________________________________________________________________________
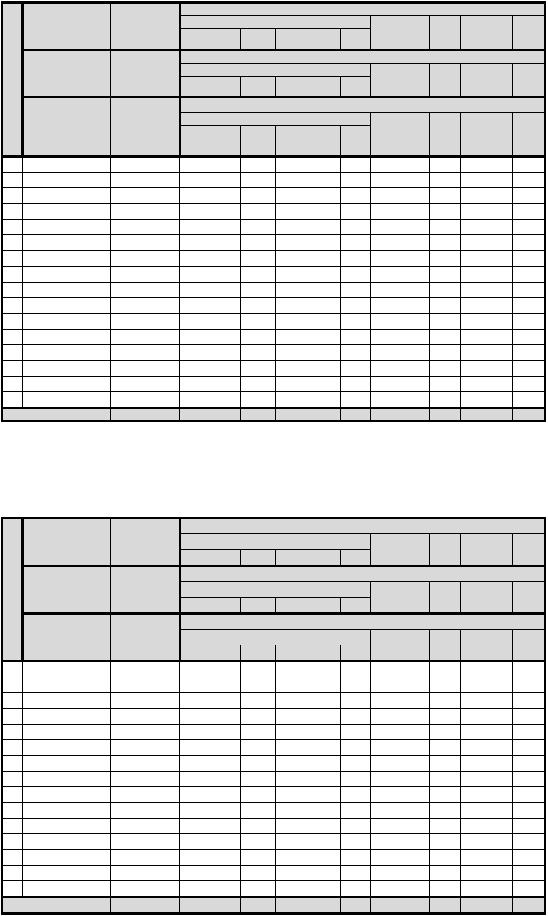
Questionnaire / Анкета / Fragebogen
Statistical data  Name of country
  Name of capital city
Year
 Population (thous.inh.)
Area (sq.km.)
 Total number of calls a year:
-fires
 -rescue, technical aid
-medical aid
 -false calls
  -other calls
Total number of fires:
Structure |
- residential (with chimneys) |
|
- all other buildings |
||
|
||
-vehicles |
|
|
-forests |
|
|
-grass, bushes… |
||
-rubbish |
|
|
-other fires |
|
|
Number of fire deaths: |
||
- residential (with chimneys)
 structure


 - all other buildings
 -vehicle
  -other
Number of fire injuries:
- residential (with chimneys)
 structure


 - all other buildings
 -vehicle
-other
 Number of firefighter deaths
Number of firefighter injuries
 Number of all firefighters:
-professionals (full time)
-part time
-volunteers
Number of femal firefighters:
-professionals (full time)
-part time
-volunteers
Number of young (junior) firefighters:
Number of fire stations
Number of engines (pumps) Number of ladders and hydraulic lifts
Number of other fire automobile
_____________________________________________________________________________________________
© Copyright by Center for Fire Statistics of CTIF 2021
21
_____________________________________________________________________________________________
100 Cities – 100 Years - Evaluation Of Urban Fire Risks
Over the centuries, cities became economic, scientific, administrative, and cultural centers of the countries. This process accelerated significantly in the 20th century. Life in the cities has become very pleasant for their inhabitants. Notwithstanding these manifold benefits of city life, the administrations of urban centers increasingly confronted problems: The streets of the cities are suffering from the ever-increasing mass of vehicles. Noise and air pollution are the results. Housing is scarce in the centers. The cities grow in height and on the outskirts. The supply of drinking water is a problem in many places. Waste management is a significant organizational and technical challenge for the city administration. One of the most critical issues within the increasingly complex infrastructure of large cities is the safety and security factor. It is no coincidence that the municipalities have set up special services that deal with these problems: police, fire brigade, emergency services, disaster services for the gas, electricity, gas supply, and communication networks (telephone, Internet). The purpose of the book is to take a closer look at the subject of fire safety. In the last century, cities have experienced various revelations with introducing new building materials, new types of buildings, and new ways of using the facilities. Many advances in fire prevention have been made. Nevertheless, the fire danger in the cities is not banished.
The Center of Fire Statistics of CTIF invites the large cities of the World to participate in the international book project "100 Year - 100 Cities - Evaluation of Urban Fire Risks".
The city's task is: collect related data on fire risks for the town, write an article on the city's history, and write an essay on the history of firefighting. Center of Fire Statistics of CTIF kindly asks to nominate a contact person. Any feedback and comments are welcome.
_____________________________________________________________________________________________
© Copyright by Center for Fire Statistics of CTIF 2021
22
_____________________________________________________________________________________________
Participation of cities in alphabetical order:
Amman (Jordan) |
Helsinki (Finland) |
Philadelphia (United States) |
Amsterdam (Netherlands) |
Hong Kong (China) |
Phoenix (United States) |
Athens (Greece) |
Houston (United States) |
Porto (Portugal) |
Baltimore (United States) |
Istanbul / Constantinople |
Prague (Czech Republic) |
Barcelona (Spain) |
(Turkey) |
Pune (India) |
Bari (Italy) |
Jakarta (Indonesia) |
Quito (Ecuador) |
Beijing (China) |
Kaliningrad / Konigsberg |
Rio de Janeiro (Brazil) |
Belgrade (Serbia) |
(Russia) |
Rome (Italy) |
Berlin (Germany) |
Kansas City (United States) |
Sacramento (United States) |
Bern (Switzerland) |
Kawasaki (Japan) |
San Antonio (United States) |
Bogota (Colombia) |
Klagenfurt (Austria) |
San Francisco (United States) |
Bologna (Italy) |
Kobe (Japan) |
San Marino (Italy) |
Boston (United States) |
Kuala Lumpur (Malaysia) |
Sankt Petersburg (Russia) |
Bratislava (Slovakia) |
Kuwait City (Kuwait) |
Santiago de Chile (Chile) |
Budapest (Hungary) |
Kyoto (Japan) |
Sapporo (Japan) |
Buenos Aires (Argentina) |
Lima (Peru) |
Seoul (Korea) |
Busan (Korea) |
Linz (Austria) |
Shanghai (China) |
Calgary (Canada) |
Ljubljana (Slovenia) |
Singapore (Singapore) |
Chennai / Madras (India) |
London (United Kingdom) |
Sydney (Australia) |
Chicago (United States) |
Macau (China) |
Taipei (Taiwan, Province of |
Cologne (Germany) |
Madrid (Spain) |
China) |
Copenhagen (Denmark) |
Manila (The Philippines) |
Tallinn (Estonia) |
Delhi (India) |
Mexico-City (Mexico) |
Tokyo (Japan) |
Dhaka (Bangladesh) |
Milan (Italy) |
Toronto (Canada) |
Dubai (United Arab Emirates) |
Montevideo (Uruguay) |
Turin (Italy) |
Dublin (Ireland) |
Moscow (Russia) |
Valparaiso (Chile) |
Edmonton (Canada) |
Mumbai / Bombay (India) |
Vatican City (Holy See) |
Fairfax County (United States) |
Munich (Germany) |
Venice (Italy) |
Florence (Italy) |
Nagoya (Japan) |
Vienna (Austria) |
Frankfurt Main (Germany) |
Naples (Italy) |
Warsaw (Poland) |
Genoa (Italy) |
New York City (United States) |
Winnipeg (Canada) |
Gibraltar (Gibraltar) |
Oklahoma (United States) |
Yerevan (Armenia) |
Graz (Austria) |
Osaka (Japan) |
Yokohama (Japan) |
Guatemala City (Guatemala) |
Oslo (Norway) |
Zagreb (Croatia) |
Guayaquil (Ecuador) |
Palermo (Italy) |
Zurich (Switzerland) |
Hamburg (Germany) |
Paris (France) |
|
Hartford City (United States) |
Perth (Australia) |
|
Miss your hometown? You might know who is writing the chapter about your city? Are you interested in working on the project? Would your company like to support the project? Any help, support, comments, and advice are welcome! You can use the emails below for this purpose.
_____________________________________________________________________________________________
© Copyright by Center for Fire Statistics of CTIF 2021

|
|
|
|
|
|
Table/Таблица/Tabelle 1.1 |
|
|
|
Total reported fire statistical data, by country, 1993-2019 |
|
|
|||
|
Обобщенные данные об обстановке с пожарами в странах мира за 1993-2019 гг. |
|
|||||
|
Verdichtete Daten zur Brandsituation der Staaten in den Jahren 1993-2019 |
|
|||||
|
Number |
Total |
Number |
Number |
Average number |
Average number of fire deaths |
|
Year |
of |
population, |
of fires, |
of fire deaths, |
of fires |
per |
per |
|
countries |
bln.inh. |
mln. |
thous. |
per 1000 inh. |
100000 inh. |
100 fires |
|
Число |
Суммарное |
Число |
Число |
Среднее число |
Среднее число погибших |
|
Год |
стран |
население, |
пожаров, |
погибших, |
пожаров |
на 100000 |
на 100 |
|
|
млрд.чел. |
млн. |
тыс. |
на 1000 чел. |
чел. |
пожаров |
|
Anzahl |
Gesamt- |
Anzahl |
Anzahl |
Mittelwert der |
Mittelwert der Brandtotenanzahl |
|
Jahr |
der |
bevölkerung |
der Brände |
der Brandtoten |
Brandanzahl |
je. 100000 |
je 100 |
|
Staaten |
in Mrd. |
in Mio. |
in 1000 |
je 1.000 Einw. |
Einw. |
Brände |
1993 |
39 |
2,4 |
3,9 |
30,2 |
1,6 |
1,3 |
0,8 |
1994 |
27 |
1,1 |
4,0 |
29,5 |
3,6 |
2,7 |
0,7 |
1995 |
42 |
1,2 |
4,5 |
32,5 |
3,8 |
2,7 |
0,7 |
1996 |
43 |
0,9 |
4,0 |
29,1 |
4,4 |
3,2 |
0,7 |
1997 |
48 |
2,8 |
3,7 |
57,7 |
1,3 |
2,1 |
1,6 |
1998 |
47 |
3,0 |
3,6 |
51,7 |
1,2 |
1,7 |
1,4 |
1999 |
52 |
3,1 |
3,9 |
51,8 |
1,3 |
1,7 |
1,3 |
2000 |
57 |
3,3 |
4,5 |
56,2 |
1,4 |
1,7 |
1,2 |
2001 |
46 |
3,5 |
3,8 |
61,9 |
1,1 |
1,8 |
1,6 |
2002 |
41 |
3,5 |
4,3 |
62,3 |
1,2 |
1,8 |
1,4 |
2003 |
39 |
3,5 |
4,5 |
61,1 |
1,3 |
1,7 |
1,4 |
2004 |
44 |
3,5 |
4,1 |
60,1 |
1,2 |
1,7 |
1,5 |
2005 |
45 |
3,5 |
4,3 |
57,4 |
1,2 |
1,6 |
1,3 |
2006 |
37 |
3,6 |
4,1 |
52,2 |
1,1 |
1,5 |
1,3 |
2007 |
40 |
3,8 |
4,0 |
52,5 |
1,1 |
1,4 |
1,3 |
2008 |
31 |
3,5 |
3,6 |
48,3 |
1,0 |
1,4 |
1,3 |
2009 |
31 |
3,4 |
3,3 |
44,7 |
1,0 |
1,3 |
1,4 |
2010 |
33 |
2,2 |
3,2 |
46,1 |
1,5 |
2,1 |
1,4 |
2011 |
34 |
2,3 |
3,3 |
48,2 |
1,4 |
2,1 |
1,5 |
2012 |
35 |
1,1 |
3,1 |
23,7 |
2,8 |
2,2 |
0,8 |
2013 |
31 |
1,1 |
2,5 |
21,7 |
2,3 |
2,0 |
0,9 |
2014 |
32 |
1,1 |
2,7 |
20,7 |
2,5 |
1,9 |
0,8 |
2015 |
31 |
1,0 |
3,5 |
18,4 |
3,5 |
1,8 |
0,5 |
2016 |
39 |
1,1 |
3,0 |
18,0 |
2,7 |
1,6 |
0,6 |
2017 |
34 |
1,1 |
3,2 |
16,9 |
2,9 |
1,5 |
0,5 |
2018 |
46 |
2,7 |
4,5 |
30,8 |
1,7 |
1,1 |
0,7 |
2019 |
34 |
1,3 |
3,1 |
19,2 |
2,4 |
1,5 |
0,6 |
Avrg./Сред./Mittl. |
39 |
2,4 |
3,7 |
40,8 |
1,6 |
1,7 |
1,1 |
Total/Итого/Gesamt |
100,2 |
1102,9 |
|
|
|
||

|
|
|
|
|
|
|
|
|
|
|
Table/Таблица/Tabelle 1.2 |
|
|
|
|
Common indicators of fire statistics in the countries of the World in 2019 |
|
|
|||||||
|
|
Укрупненные показатели объема работы и обстановки с пожарами в странах мира в 2019 г. |
|
|
||||||||
|
|
|
Verdichtete Kennzahlen der Brandsituation in den Staaten für das Jahr 2019 |
|
|
|||||||
|
|
Population, |
|
Number of |
|
|
|
Average number: |
|
|
||
|
Country |
|
|
fire |
fire |
per 1000 inh.: |
fire deaths per: |
fire injuries per: |
||||
|
thous.inh. |
calls |
fires |
|||||||||
|
|
deaths |
injuries |
calls |
fires |
100000 inh. |
100 fires |
100000 inh. |
100 fires |
|||
|
|
|
|
|
||||||||
|
|
Население, |
|
Число |
|
|
|
Среднее число: |
|
|
||
№ |
Страна |
|
|
|
травмиро- |
на 1000 чел.: |
погибших на: |
травмированных на: |
||||
тыс.чел. |
выездов |
пожаров |
погибших |
|||||||||
|
|
|
|
|
|
ванных |
выездов пожаров |
100000 чел. |
100 пожаров |
100000 чел. |
100 пожаров |
|
|
|
Einwohner, |
|
Absolute Anzahl |
|
|
|
Mittelwerte: |
|
|
||
|
Staat |
|
|
Brand- |
|
je 1000 Einw. |
Brandtotenzahl |
Verletztenzahl |
||||
|
in 1000 |
Einsätze |
Brände |
Verletzte |
||||||||
|
|
tote |
Einsätze |
Brände |
100000 Einw. |
100 Brände |
100000 Einw. |
100 Brände |
||||
1 |
USA |
328 240 37 272 000 |
1 291 500 |
3 704 |
16 600 |
113,6 |
3,9 |
1,1 |
0,3 |
5,1 |
1,3 |
|
2 |
Russia |
146 781 |
1 161 581 |
471 426 |
8 559 |
9 461 |
7,9 |
3,2 |
5,8 |
1,8 |
6,4 |
2,0 |
3 |
Japan |
126 167 |
8 786 855 |
37 683 |
1 486 |
5 865 |
69,6 |
0,3 |
1,2 |
3,9 |
4,6 |
15,6 |
4 |
Egypt |
100 075 |
- |
50 662 |
252 |
1 203 |
- |
0,5 |
0,3 |
0,5 |
1,2 |
2,4 |
5 |
Vietnam |
95 990 |
- |
3 790 |
85 |
126 |
- |
0,0 |
0,1 |
2,2 |
0,1 |
3,3 |
6 |
France |
66 628 |
4 819 900 |
316 100 |
261 |
1 289 |
72,3 |
4,7 |
0,4 |
0,1 |
1,9 |
0,4 |
7 |
Great Britain |
64 903 |
705 924 |
222 511 |
317 |
8 750 |
10,9 |
3,4 |
0,5 |
0,1 |
13,5 |
3,9 |
8 |
Republic of Korea |
51 629 |
- |
40 030 |
284 |
2 219 |
- |
0,8 |
0,6 |
0,7 |
4,3 |
5,5 |
9 |
Myanmar |
51 466 |
- |
2 155 |
79 |
226 |
- |
0,0 |
0,2 |
3,7 |
0,4 |
10,5 |
10 |
Ukraine |
42 029 |
269 160 |
96 812 |
1 909 |
1 523 |
6,4 |
2,3 |
4,5 |
2,0 |
3,6 |
1,6 |
11 |
Poland |
38 411 |
512 514 |
153 520 |
508 |
3 782 |
13,3 |
4,0 |
1,3 |
0,3 |
9,8 |
2,5 |
12 |
Kazachstan |
18 611 |
63 727 |
13 850 |
323 |
978 |
3,4 |
0,7 |
1,7 |
2,3 |
5,3 |
7,1 |
13 |
Netherlands |
17 282 |
143 500 |
38 900 |
22 |
- |
8,3 |
2,3 |
0,1 |
0,1 |
- |
- |
14 |
Greece |
10 788 |
72 545 |
27 784 |
21 |
36 |
6,7 |
2,6 |
0,2 |
0,1 |
0,3 |
0,1 |
15 |
Jordan |
10 659 |
769 780 |
36 650 |
52 |
10 902 |
72,2 |
3,4 |
0,5 |
0,1 |
102,3 |
29,7 |
16 |
Czech Republic |
10 650 |
2 298 681 |
18 813 |
128 |
1 388 |
215,8 |
1,8 |
1,2 |
0,7 |
13,0 |
7,4 |
17 |
Sweden |
10 328 |
128 044 |
26 445 |
78 |
882 |
7,7 |
2,0 |
1,1 |
0,3 |
8,5 |
3,3 |
18 |
Hungary |
9 772 |
79 922 |
20 913 |
113 |
758 |
8,2 |
2,1 |
1,2 |
0,5 |
7,8 |
3,6 |
19 |
Belarus |
9 408 |
81 590 |
6 100 |
489 |
444 |
8,7 |
0,6 |
5,2 |
8,0 |
4,7 |
7,3 |
20 |
Austria |
8 859 |
278 672 |
43 370 |
- |
- |
31,5 |
4,9 |
- |
- |
- |
- |
21 |
Switzerland |
8 500 |
70 939 |
12 935 |
- |
- |
8,3 |
1,5 |
- |
- |
- |
- |
22 |
Bulgaria |
7 050 |
68 610 |
42 141 |
134 |
293 |
- |
6,0 |
1,9 |
0,3 |
4,2 |
0,7 |
23 |
Singapore |
5 612 |
194 330 |
2 862 |
1 |
142 |
34,6 |
0,5 |
0,0 |
0,0 |
2,5 |
5,0 |
24 |
Slovakia |
5 458 |
123 484 |
9 602 |
45 |
343 |
22,6 |
1,8 |
0,8 |
0,5 |
6,3 |
3,6 |
25 |
Ireland |
4 920 |
120 024 |
20 756 |
16 |
- |
24,4 |
4,2 |
0,3 |
0,1 |
- |
- |
26 |
New Zealand |
4 748 |
83 359 |
23 258 |
33 |
- |
17,6 |
4,9 |
0,7 |
0,1 |
- |
- |
27 |
Croatia |
4 058 |
31 393 |
14 980 |
30 |
166 |
7,7 |
3,7 |
0,7 |
0,2 |
4,1 |
1,1 |
28 |
Mongolia |
3 296 |
1 357 294 |
4 209 |
54 |
68 |
411,8 |
1,3 |
1,6 |
1,3 |
2,1 |
1,6 |
29 |
Lithuania |
2 794 |
30 666 |
11 509 |
70 |
164 |
11,0 |
4,1 |
2,5 |
0,6 |
5,9 |
1,4 |
30 |
Slovenia |
2 095 |
153 758 |
4 427 |
13 |
209 |
73,4 |
2,1 |
0,6 |
0,3 |
10,0 |
4,7 |
31 |
Latvia |
1 920 |
20 749 |
10 095 |
76 |
279 |
- |
5,3 |
4,0 |
0,8 |
14,5 |
2,8 |
32 |
Estonia |
1 329 |
26 076 |
4 675 |
43 |
113 |
19,6 |
3,5 |
3,2 |
0,9 |
8,5 |
2,4 |
33 |
Brunei |
430 |
- |
2 053 |
1 |
8 |
- |
4,8 |
0,2 |
0,0 |
1,9 |
0,4 |
34 |
Liechtenstein |
39 |
- |
49 |
1 |
- |
- |
1,3 |
2,6 |
2,0 |
- |
- |
Total/Итого/Gesamt |
1 270 925 |
59 725 077 |
3 082 565 |
19 187 |
68 217 |
47,0 |
2,4 |
1,5 |
0,6 |
5,4 |
2,2 |
|

|
|
|
|
|
|
|
|
|
|
|
Table/Таблица/Tabelle 1.3 |
|
|
|
|
|
Type of fire service calls in the countries of the World in 2019 |
|
|
|
|||||
|
|
Структура объема боевой работы противопожарных служб в странах мира в 2019 г. |
|
|
|
|||||||
|
|
|
|
Struktur der Feuerwehreinsätze in den Staaten im Jahr 2019 |
|
|
|
|
||||
|
|
Population |
|
|
|
|
Number of calls |
|
|
|
|
|
|
Country |
thous.inh. |
fires |
in |
accidents* |
in |
medical |
in |
false |
in |
other |
in |
|
|
|
% |
% |
aid |
% |
calls |
% |
% |
|||
|
|
|
|
|
|
|||||||
|
|
Население, |
|
|
|
|
Число выездов |
|
|
|
|
|
№ |
Страна |
тыс. чел. |
на |
в |
на |
в |
мед. |
в |
ложные |
в |
другие |
в |
|
|
|
пожары |
% |
аварии |
% |
помощь |
% |
вызовы |
% |
% |
|
|
|
|
|
|||||||||
|
|
Einwohner |
|
|
|
|
Anzahl der Einsätze ... |
|
|
|
|
|
|
Staat |
in 1000 |
zu |
in |
zu |
in |
Medizin. |
in |
Fehl- |
in |
Sonstiges |
in |
|
|
|
Bränden |
% |
Havarien |
% |
Hilfe |
% |
einsätze |
% |
% |
|
|
|
|
|
|||||||||
1 |
USA |
328 240 |
1 291 500 |
3,5 |
- |
- |
24 481 000 |
65,7 |
2 893 000 |
7,8 |
8 606 500 |
23,1 |
2 |
Russia |
146 781 |
471 426 |
40,2 |
113 375 |
9,7 |
- |
- |
269 756 |
23,0 |
319 428 |
27,2 |
3 |
Japan |
126 167 |
77 334 |
0,9 |
- |
- |
6 227 150 |
70,9 |
391 444 |
4,5 |
2 090 927 |
23,8 |
4 |
France |
66 628 |
316 100 |
6,6 |
60 900 |
1,3 |
4 095 000 |
85,0 |
- |
- |
348 000 |
7,2 |
5 |
Ukraine |
42 029 |
96 812 |
36,0 |
37 727 |
14,0 |
- |
- |
34 443 |
12,8 |
100 178 |
37,2 |
6 |
Poland |
38 411 |
153 520 |
30,0 |
70 954 |
13,8 |
33 943 |
6,6 |
42 800 |
8,4 |
211 297 |
41,2 |
7 |
Kazachstan |
18 611 |
13 850 |
22,5 |
6 782 |
11,0 |
- |
- |
174 |
0,3 |
40 731 |
66,2 |
8 |
Greece |
10 788 |
27 784 |
38,3 |
19 809 |
27,3 |
- |
- |
6 809 |
9,4 |
18 143 |
25,0 |
9 |
Jordan |
10 659 |
17 488 |
2,2 |
26 608 |
3,3 |
723 684 |
89,7 |
996 |
0,1 |
37 893 |
4,7 |
10 |
Sweden |
10 328 |
26 445 |
20,7 |
33 024 |
25,8 |
13 696 |
10,7 |
44 617 |
34,8 |
10 262 |
8,0 |
11 |
Hungary |
9 772 |
20 913 |
27,9 |
35 819 |
47,8 |
- |
- |
18 245 |
24,3 |
- |
- |
12 |
Belarus |
9 408 |
6 100 |
7,5 |
32 686 |
40,1 |
2 588 |
3,2 |
2 384 |
2,9 |
37 782 |
46,3 |
13 |
Austria |
8 859 |
43 370 |
17,0 |
169 876 |
66,7 |
- |
- |
11 411 |
4,5 |
30 103 |
11,8 |
14 |
Switzerland |
8 500 |
12 935 |
24,2 |
14 020 |
26,2 |
- |
- |
16 835 |
31,5 |
9 693 |
18,1 |
15 |
Bulgaria |
7 050 |
42 141 |
61,4 |
13 849 |
20,2 |
- |
- |
2 138 |
3,1 |
10 482 |
15,3 |
16 |
Singapore |
5 612 |
2 862 |
1,5 |
- |
- |
191 468 |
98,5 |
- |
- |
- |
- |
17 |
Slovakia |
5 458 |
9 602 |
8,0 |
8 391 |
3,8 |
532 |
0,4 |
647 |
0,5 |
100 476 |
84,0 |
18 |
Ireland |
4 922 |
20 756 |
17,3 |
6 924 |
5,7 |
79 031 |
65,8 |
5 799 |
4,8 |
7 514 |
6,3 |
19 |
New Zealand |
4 748 |
23 258 |
27,9 |
9 892 |
8,3 |
13 728 |
16,5 |
- |
- |
36 481 |
43,8 |
20 |
Croatia |
4 058 |
14 980 |
39,7 |
14 470 |
42,8 |
509 |
1,4 |
5 799 |
15,4 |
1 943 |
5,2 |
21 |
Mongolia |
3 297 |
4 209 |
0,3 |
781 |
0,1 |
1 352 040 |
99,6 |
264 |
0,0 |
- |
- |
22 |
Lithuania |
2 794 |
13 163 |
42,9 |
10 224 |
33,3 |
0 |
0,0 |
180 |
0,6 |
7 099 |
23,1 |
23 |
Slovenia |
2 081 |
4 427 |
2,9 |
15 376 |
10,0 |
120 844 |
78,6 |
|
- |
13 111 |
8,5 |
24 |
Latvia |
1 920 |
10 095 |
48,7 |
7 176 |
34,6 |
- |
- |
3 478 |
16,8 |
- |
- |
25 |
Estonia |
1 329 |
4 675 |
17,9 |
9 331 |
35,8 |
- |
- |
7 117 |
27,3 |
4 953 |
19,0 |
Total/Итого/Gesamt: |
878 450 |
2 725 745 |
4,8 |
717 994 |
1,3 |
37 335 213 |
66,0 |
3 758 336 |
6,6 |
12 042 996 |
21,3 |
|
* - This position includes all kinds of non-fire incidents

Table/Таблица/Tabelle 1.4
Distribution of fires by types in the countries of the World in 2019
Распределение пожаров по местам возникновения в странах мира в 2019 г. Verteilung der Brände nach Objekten der Brandentstehung in den Staaten im Jahr 2019
|
|
Population, |
|
|
|
|
|
|
Number of fires … |
|
|
|
|
|
|
|
||
|
Country |
|
|
structure fires |
|
|
|
|
|
|
|
|
|
|
|
|
||
|
|
|
|
|
|
|
|
|
|
|
|
|
|
|
|
|||
|
thous.inh. |
|
|
|
|
|
|
vehicles |
in % |
forests |
in % |
grass, brush |
in % |
rubbish |
in % |
other |
in % |
|
|
|
residential |
in % |
others |
in % |
all |
in % |
|||||||||||
|
|
|
|
|
|
|
|
|
|
|
|
|
||||||
|
|
Население, |
|
|
|
|
|
|
Число пожаров … |
|
|
|
|
|
|
|
||
№ |
Страна |
|
|
в зданиях |
|
|
|
не транс- |
|
|
|
травы, |
|
мусора, |
|
|
|
|
|
|
|
|
|
|
|
|
|
|
|
|
|
||||||
тыс.чел. |
|
|
|
|
|
|
в % |
в лесах |
в % |
в % |
в % |
другие |
в % |
|||||
|
|
жилые |
в % |
другие |
в % |
все |
в % |
порте |
кустов |
свалок |
||||||||
|
|
|
|
|
|
|
|
|
|
|||||||||
|
|
Einwohner |
|
|
|
|
|
|
Anzahl der Brände … |
|
|
|
|
|
|
|
||
|
Staat |
|
|
in Gebäuden |
|
|
|
|
|
|
|
|
|
Abfall, |
|
|
|
|
|
in 10000 |
|
|
|
|
|
Transport |
in % |
im Wald |
in % |
Gras usw. |
in % |
in % |
Sonstige |
in % |
|||
|
|
Wohnung |
in % |
andere |
in % |
alle |
in % |
Müll |
||||||||||
|
|
|
|
|
|
|
|
|
|
|
|
|||||||
1 |
USA |
328 240 |
361 500 |
28,0 |
120 000 |
9,3 |
481 500 |
37,3 |
223 000 |
17,3 |
- |
- |
244 500 |
18,9 |
177 500 |
13,7 |
165 000 |
12,8 |
2 |
Russia |
146 781 |
117 844 |
25,0 |
37 174 |
7,9 |
155 018 |
32,9 |
17 896 |
3,8 |
128 |
0,0 |
139 495 |
29,6 |
80 392 |
17,1 |
78 497 |
16,7 |
3 |
Japan |
126 167 |
- |
- |
- |
- |
2 103 |
11,2 |
3 585 |
19,1 |
- |
- |
1391 |
7,4 |
- |
- |
11704 |
62,3 |
4 |
France |
66 628 |
2 484 |
1,0 |
19 120 |
7,6 |
21 604 |
8,6 |
56 191 |
22,4 |
- |
- |
66 836 |
26,6 |
- |
- |
106 164 |
42,3 |
5 |
Ukraine |
42 029 |
30 565 |
31,2 |
2 638 |
2,7 |
33 203 |
33,9 |
4 451 |
4,5 |
1 261 |
1,3 |
- |
0,0 |
56 149 |
57,4 |
2 772 |
2,8 |
6 |
Poland |
38 411 |
16 086 |
10,5 |
15 908 |
10,4 |
31 994 |
20,8 |
9 910 |
6,5 |
8 896 |
5,8 |
24 097 |
15,7 |
19 253 |
12,5 |
59 390 |
38,7 |
7 |
Kazachstan |
18 611 |
9 415 |
62,2 |
1 290 |
8,5 |
10 705 |
70,7 |
2 544 |
16,8 |
628 |
4,1 |
72 |
0,5 |
673 |
4,4 |
518 |
3,4 |
8 |
Netherlands |
17 282 |
5 240 |
13,5 |
4 220 |
10,8 |
9 460 |
24,3 |
3 730 |
9,6 |
480 |
1,2 |
2 470 |
6,3 |
1 980 |
5,1 |
20 780 |
53,4 |
9 |
Greece |
10 788 |
4 113 |
14,8 |
528 |
1,9 |
4 641 |
16,7 |
1 606 |
5,8 |
1 536 |
5,5 |
5 767 |
20,8 |
1 097 |
3,9 |
13 137 |
47,3 |
10 |
Jordan |
10 659 |
3 063 |
8,4 |
1 726 |
4,7 |
4 789 |
13,1 |
1 729 |
4,7 |
23 551 |
64,4 |
1 268 |
3,5 |
3 367 |
9,2 |
1 862 |
5,1 |
11 |
Czech Republic |
10 650 |
3 151 |
16,7 |
1 369 |
7,3 |
4 520 |
24,0 |
2 206 |
11,7 |
1 963 |
10,4 |
608 |
3,2 |
4 515 |
24,0 |
5 001 |
26,6 |
12 |
Sweden |
10 328 |
7 191 |
26,9 |
3 963 |
14,8 |
11 154 |
41,7 |
5 064 |
18,9 |
2 753 |
10,3 |
2 724 |
10,2 |
2 299 |
8,6 |
2 751 |
10,3 |
13 |
Hungary |
9 772 |
4 451 |
21,3 |
4 658 |
22,3 |
9 109 |
43,6 |
691 |
3,3 |
- |
- |
7 296 |
34,9 |
1 961 |
9,4 |
1 856 |
8,9 |
14 |
Austria |
8 859 |
- |
- |
- |
- |
18 231 |
49,1 |
1 890 |
5,1 |
2795 |
7,5 |
- |
0,0 |
- |
- |
14215 |
38,3 |
15 |
Singapore |
5 612 |
1 168 |
41,1 |
496 |
17,5 |
1 664 |
58,6 |
195 |
6,9 |
- |
- |
863 |
30,4 |
- |
- |
120 |
4,2 |
16 |
Slovakia |
5 458 |
359 |
2,9 |
2 489 |
20,0 |
2 848 |
22,9 |
885 |
7,1 |
272 |
2,2 |
2 173 |
17,5 |
1 678 |
13,5 |
4 594 |
36,9 |
17 |
New Zealand |
4 748 |
5 588 |
24,0 |
11 670 |
50,2 |
17 258 |
74,2 |
5 390 |
23,2 |
- |
- |
609 |
2,6 |
- |
- |
- |
0,0 |
18 |
Croatia |
4 058 |
1 119 |
7,5 |
3 055 |
20,4 |
4 174 |
27,9 |
953 |
6,4 |
- |
- |
6 447 |
43,0 |
2 128 |
14,2 |
1 278 |
8,5 |
19 |
Mongolia |
3 297 |
1 083 |
25,0 |
463 |
10,7 |
1 546 |
35,7 |
321 |
7,4 |
121 |
2,8 |
245 |
5,7 |
1 605 |
37,1 |
492 |
11,4 |
20 |
Lithuania |
2 794 |
1 652 |
14,4 |
1870 |
16,2 |
3 522 |
30,6 |
1 078 |
9,4 |
503 |
4,4 |
2 568 |
22,3 |
2218 |
19,3 |
1620 |
14,1 |
21 |
Slovenia |
2 081 |
- |
- |
- |
- |
1 981 |
44,7 |
490 |
11,0 |
- |
- |
1 642 |
37,1 |
- |
- |
314 |
7,1 |
22 |
Latvia |
1 920 |
216 |
2,1 |
1 965 |
19,5 |
2 181 |
21,6 |
600 |
5,9 |
1 110 |
11,0 |
3 368 |
33,4 |
1 146 |
11,4 |
1 690 |
16,7 |
23 |
Estonia |
1 329 |
774 |
16,6 |
434 |
9,3 |
1 208 |
25,8 |
383 |
8,2 |
- |
- |
1 049 |
22,4 |
1 573 |
33,6 |
462 |
9,9 |
24 |
Liechtenstein |
39 |
17 |
34,7 |
25 |
51,0 |
42 |
85,7 |
0 |
0,0 |
0 |
0,0 |
5 |
10,2 |
2 |
4,1 |
0 |
0,0 |
Total/Итого/Gesamt: |
876 541 |
577 079 |
22,4 |
235 061 |
9,1 |
812 140 |
31,6 |
344 788 |
13,4 |
45 997 |
1,8 |
515 493 |
20,0 |
359 536 |
14,0 |
494 217 |
19,2 |
|
Table/Таблица/Tabelle 1.5
Distribution of fire deaths by type of fires in the countries of the World in 2019
Распределение погибших при пожарах по объектам пожаров в странах мира в 2019 г. Verteilung der Brändtote nach Objekten der Brandentstehung in den Staaten im Jahr 2019
|
|
|
|
|
Number of fire deaths |
|
|
|
||
|
Country |
Population, |
|
structure fires |
|
|
|
|
|
|
|
|
|
|
|
|
|
|
|||
|
thous.inh. |
|
|
|
|
vehicles |
in % |
other |
in % |
|
|
|
residential |
in % |
all others |
in % |
|||||
|
|
|
|
|
|
|
||||
|
|
|
|
|
Число погибших |
|
|
|
||
|
Страна |
Население, |
|
в зданиях |
|
не транс- |
|
|
|
|
|
|
|
|
|
|
|
||||
№ |
тыс.чел. |
|
|
|
|
в % |
другие |
в % |
||
|
жилые |
в % |
все другие |
в % |
порте |
|||||
|
|
|
|
|
|
|||||
|
|
|
|
|
Anzahl der Brändtote |
|
|
|
||
|
Staat |
Einwohner |
|
in Gebäuden |
|
|
|
|
|
|
|
in 10000 |
|
|
|
|
Transport |
in % |
Sonstige |
in % |
|
|
|
Wohnung |
in % |
andere |
in % |
|||||
|
|
|
|
|
|
|
||||
1 |
USA |
328 240 |
2 870 |
77,5 |
110 |
3,0 |
644 |
17,4 |
80 |
2,2 |
2 |
Russia |
146 781 |
7 705 |
90,0 |
489 |
5,7 |
108 |
1,3 |
257 |
3,0 |
3 |
Ukraine |
42 029 |
1 716 |
89,9 |
53 |
2,8 |
19 |
1,0 |
121 |
6,3 |
4 |
Poland |
38 411 |
174 |
34,3 |
225 |
44,3 |
40 |
7,9 |
69 |
13,6 |
5 |
Greece |
10 788 |
15 |
71,4 |
0 |
0,0 |
0 |
0,0 |
6 |
28,6 |
6 |
Jordan |
10 659 |
46 |
88,5 |
6 |
11,5 |
0 |
0,0 |
0 |
0,0 |
7 |
Czech Republic |
10 650 |
47 |
36,7 |
24 |
18,8 |
29 |
22,7 |
28 |
21,9 |
8 |
Sweden |
10 329 |
63 |
80,8 |
5 |
6,4 |
9 |
11,5 |
1 |
1,3 |
9 |
Hungary |
9 772 |
92 |
81,4 |
8 |
7,1 |
1 |
0,9 |
12 |
10,6 |
10 |
Slovakia |
5 458 |
15 |
33,3 |
28 |
62,2 |
1 |
2,2 |
1 |
2,2 |
11 |
Croatia |
4 058 |
0 |
0,0 |
19 |
63,3 |
6 |
20,0 |
5 |
16,7 |
12 |
Mongolia |
3 297 |
19 |
35,2 |
32 |
59,3 |
2 |
3,7 |
1 |
1,9 |
13 |
Lithuania |
2 794 |
46 |
65,7 |
19 |
27,1 |
2 |
2,9 |
3 |
4,3 |
14 |
Latvia |
1 920 |
17 |
22,4 |
53 |
69,7 |
0 |
0,0 |
6 |
7,9 |
15 |
Estonia |
1 329 |
41 |
95,3 |
0 |
0,0 |
1 |
2,3 |
1 |
2,3 |
16 |
Liechtenstein |
602 |
1 |
100,0 |
0 |
0,0 |
0 |
0,0 |
0 |
0,0 |
Total/Итого/Gesamt: |
627 117 |
12 867 |
83,6 |
1 071 |
7,0 |
862 |
5,6 |
591 |
3,8 |
|
Table/Таблица/Tabelle 1.6
Distribution of fire injuries by type of fire in the countries of the World in 2019
Распределение травмируемых по объектам пожаров в странах мира в 2019 г.
Verteilung der Verletzte nach Objekten der Brandentstehung in den Staaten im Jahr 2019
Country
№Страна
Staat
Population,
thous.inh.
Население, тыс.чел.
Einwohner
in 10000
|
|
Number of fire injuries |
|||
|
structure fires |
|
vehicles |
||
residential |
in % |
all others |
in % |
||
|
|||||
|
|
Число травмированных |
|||
|
в зданиях |
|
не транс- |
||
жилые |
в % |
все другие |
в % |
порте |
|
Anzahl der Verletzte
in % other in %
в % другие в %
in Gebäuden
Transport in % Sonstige in %
Wohnung in % andere in %
1 |
USA |
328 240 |
12 700 |
76,5 |
1 200 |
7,2 |
2 000 |
12,0 |
700 |
4,2 |
2 |
Russia |
146 781 |
6 715 |
87,1 |
628 |
8,1 |
108 |
1,4 |
257 |
3,3 |
3 |
Ukraine |
42 029 |
1 179 |
77,4 |
102 |
6,7 |
83 |
5,4 |
159 |
10,4 |
4 |
Poland |
38 411 |
938 |
24,8 |
1 759 |
46,5 |
268 |
7,1 |
817 |
21,6 |
5 |
Greece |
10 788 |
17 |
47,2 |
1 |
2,8 |
5 |
13,9 |
13 |
36,1 |
6 |
Jordan |
10 659 |
770 |
69,9 |
332 |
30,1 |
0 |
0,0 |
0 |
0,0 |
7 |
Czech Republic |
10 650 |
726 |
52,3 |
235 |
16,9 |
205 |
14,8 |
222 |
16,0 |
8 |
Sweden |
10 329 |
640 |
72,6 |
90 |
10,2 |
61 |
6,9 |
91 |
10,3 |
9 |
Hungary |
9 772 |
559 |
73,7 |
91 |
12,0 |
25 |
3,3 |
83 |
10,9 |
10 |
Slovakia |
5 458 |
73 |
21,3 |
89 |
25,9 |
12 |
3,5 |
169 |
49,3 |
11 |
Croatia |
4 058 |
5 |
2,9 |
132 |
77,2 |
21 |
12,3 |
13 |
7,6 |
12 |
Mongolia |
3 297 |
57 |
83,8 |
6 |
8,8 |
3 |
4,4 |
2 |
2,9 |
13 |
Lithuania |
2 794 |
48 |
29,3 |
85 |
51,8 |
13 |
7,9 |
18 |
11,0 |
14 |
Latvia |
1 920 |
32 |
11,5 |
226 |
81,0 |
11 |
3,9 |
10 |
3,6 |
15 |
Estonia |
1 329 |
95 |
84,1 |
11 |
9,7 |
6 |
5,3 |
1 |
0,9 |
Total/Итого/Gesamt: |
626 515 |
24 554 |
70,3 |
4 987 |
14,3 |
2 821 |
8,1 |
2 555 |
7,3 |
|

|
|
|
|
|
|
|
|
Table/Таблица/Tabelle 1.7 |
||
|
|
Trends in calls in the countries of the World in 2015-2019 |
|
|
||||||
|
|
Динамика числа вызовов в странах мира за 2015-2019 |
|
|
||||||
|
|
Dynamik der Einsätze in den Staaten der Welt für die Jahre 2015-2019 |
|
|
||||||
|
|
Population, |
|
Number of calls |
|
|
Average |
|||
|
Country |
|
|
|
|
|
|
per 1000 |
||
|
thous. inh. |
2015 |
2016 |
2017 |
2018 |
2019 |
per year |
|||
|
|
inh. a year |
||||||||
|
|
|
|
|
|
|
|
|
||
|
|
Население, |
|
Число вызовов |
|
|
Среднее |
|||
№ |
Страна |
|
|
|
|
|
|
на 1000 |
||
тыс. чел. |
2015 |
2016 |
2017 |
2018 |
2019 |
в год |
||||
|
|
чел.в год |
||||||||
|
|
|
|
|
|
|
|
|
||
|
|
Einwohner in |
|
Gesamtanzahl der Einsätze |
|
Mittelwert |
||||
|
Staat |
|
|
|
|
|
|
je Jahr und |
||
|
1000 |
2015 |
2016 |
2017 |
2018 |
2019 |
je Jahr |
|||
|
|
1000 Einw. |
||||||||
|
|
|
|
|
|
|
|
|
||
1 |
USA |
328 240 |
33 602 500 |
35 320 000 |
34 683 500 |
34 746 500 |
37 272 000 |
35 124 900 |
107,01 |
|
2 |
Russia |
146 781 |
- |
- |
- |
995 687 |
1 161 581 |
1 078 634 |
7,35 |
|
3 |
Japan |
126 167 |
- |
- |
- |
- |
8 768 855 |
8 768 855 |
69,50 |
|
4 |
Germany |
83 020 |
3 815 875 |
3 889 339 |
4 230 433 |
- |
- |
3 978 549 |
47,92 |
|
5 |
France |
66 628 |
4 450 000 |
4 542 400 |
4 658 600 |
4 942 906 |
4 819 900 |
4 682 761 |
70,28 |
|
6 |
Great Britain |
64 903 |
617 624 |
655 248 |
689 169 |
694 771 |
705 924 |
672 547 |
10,36 |
|
7 |
Italy |
61 000 |
813 678 |
952 129 |
1 000 071 |
908 887 |
- |
918 691 |
15,06 |
|
8 |
Republic of Korea |
51 629 |
- |
- |
- |
150 069 |
- |
150 069 |
2,91 |
|
9 |
Spain |
46 570 |
- |
310 982 |
335 317 |
- |
- |
323 150 |
6,94 |
|
10 |
Ukraine |
42 029 |
194 764 |
236 928 |
229 313 |
230 952 |
269 160 |
232 223 |
5,53 |
|
11 |
Poland |
38 411 |
489 881 |
446 819 |
519 902 |
502 200 |
- |
489 701 |
12,75 |
|
12 |
Peru |
32 000 |
112 898 |
127 324 |
119 380 |
121 998 |
- |
120 400 |
3,76 |
|
13 |
Romania |
20 121 |
411 354 |
444 178 |
421 015 |
- |
- |
425 516 |
21,15 |
|
14 |
Kazachstan |
18 611 |
- |
48 398 |
59 203 |
55 102 |
63 727 |
56 608 |
3,04 |
|
15 |
Netherlands |
17 282 |
263 120 |
141 700 |
115 340 |
148 900 |
143 500 |
162 512 |
9,40 |
|
16 |
Greece |
10 788 |
- |
- |
|
65 298 |
72 545 |
68 922 |
6,39 |
|
17 |
Czech Republic |
10 650 |
- |
- |
- |
- |
2 298 681 |
2 298 681 |
215,84 |
|
18 |
Jordan |
10 659 |
- |
277 081 |
46 600 |
56 326 |
769 780 |
287 447 |
26,97 |
|
19 |
Sweden |
10 328 |
111 099 |
- |
127750 |
133955 |
128 044 |
125 212 |
12,12 |
|
20 |
Hungary |
9 772 |
59 862 |
63 320 |
77 969 |
68 337 |
79 922 |
69 882 |
7,15 |
|
21 |
Belarus |
9 408 |
69 609 |
48 996 |
46 457 |
52 974 |
81 590 |
59 925 |
6,37 |
|
22 |
Austria |
8 859 |
246 996 |
277 392 |
302 154 |
278 672 |
278 672 |
276 777 |
31,24 |
|
23 |
Switzerland |
8 500 |
70 578 |
69 975 |
72 185 |
77 304 |
70 939 |
72 196 |
8,49 |
|
24 |
Israel |
8 300 |
- |
97 000 |
- |
- |
- |
97 000 |
11,69 |
|
25 |
Bulgaria |
7 050 |
55 434 |
60 542 |
60 536 |
56 120 |
- |
58 158 |
8,25 |
|
26 |
Denmark |
5 786 |
- |
41 250 |
41 040 |
42 876 |
- |
41 722 |
7,21 |
|
27 |
Singapore |
5 612 |
170 457 |
182 268 |
188 761 |
191 492 |
194 330 |
185 462 |
33,05 |
|
28 |
Finland |
5 483 |
99 673 |
103 747 |
104 392 |
42 876 |
- |
87 672 |
15,99 |
|
29 |
Slovakia |
5 458 |
- |
- |
- |
31 326 |
123 484 |
77 405 |
14,18 |
|
30 |
Costa Rica |
4 973 |
- |
- |
67 856 |
41 881 |
- |
54 869 |
11,03 |
|
31 |
Ireland |
4 920 |
- |
- |
- |
242 631 |
120 024 |
181 328 |
36,86 |
|
32 |
New Zealand |
4 748 |
72 853 |
74 879 |
77 465 |
82 136 |
83 359 |
78 138 |
16,46 |
|
33 |
Kuwait |
4 137 |
- |
13 206 |
14 087 |
- |
- |
13 647 |
3,30 |
|
34 |
Croatia |
4 058 |
- |
- |
23 341 |
22 927 |
31 393 |
25 887 |
6,38 |
|
35 |
Mongolia |
3 296 |
- |
- |
- |
- |
1 357 294 |
1 357 294 |
411,80 |
|
36 |
Armenia |
2 973 |
22 148 |
- |
- |
- |
- |
22 148 |
7,45 |
|
37 |
Lithuania |
2 794 |
28 540 |
28 359 |
26 954 |
22 142 |
30 666 |
27 332 |
9,78 |
|
38 |
Qatar |
2 839 |
- |
- |
- |
3 125 |
- |
3 125 |
1,10 |
|
39 |
Slovenia |
2 095 |
- |
- |
- |
153 313 |
- |
153 313 |
73,18 |
|
40 |
Latvia |
1 920 |
19 311 |
18 931 |
18 638 |
- |
20 749 |
19 407 |
10,11 |
|
41 |
Estonia |
1 329 |
25 771 |
25 910 |
26 120 |
26 163 |
26 076 |
26 008 |
19,57 |
|
42 |
Mauritius |
1 300 |
- |
- |
10 941 |
12 634 |
- |
11 788 |
9,07 |
|
43 |
Luxemburg |
602 |
- |
- |
- |
61 157 |
- |
61 157 |
101,59 |
|
44 |
Malta |
421 |
- |
4 840 |
- |
- |
- |
4 840 |
11,50 |
|
Total/Итого/Gesamt |
1 302 450 |
45 824 025 |
48 503 141 |
48 394 489 |
45 263 637 |
58 972 195 |
49 391 497 |
37,92 |
||